 img-buffer-etfs1-4
I began my career as a financial advisor in 1986 with Merrill Lynch. One particular day at Merrill left an indelible impression on me. I vividly remember the panic in the office from clients and advisors on October 19, 1987. On that Monday, the Dow Jones Industrial Average crashed 22.6% and it greatly influenced the approach I wanted to take managing money for my clients. It was a valuable lesson to learn about market risk so early in my career.
Throughout my nearly four-decade career I have seen all kinds of markets – boom and bust periods that have occurred far more often than one would have thought imaginable. In addition to the October 19, 1987 crash, we’ve had two other crashes that pushed major stock indices down 50% or more (2000-2002 and 2007-2009), and the COVID Crash (2020) caused stocks to plummet 35% in 5 weeks. In all, I’ve had to navigate six bear markets, including four crashes.
Wall Street has always “sold” the concept of diversification as the solution to market volatility. We’ve been told that if we own a diversified portfolio of stocks, bonds, commodities, emerging, and international markets etc., our portfolios will hold up in any market environment. Unfortunately, this isn’t true. As recently as 2022, investors learned the hard way that sometimes nearly all asset classes are highly correlated and lose money at the same time. Stocks and bonds were both decimated in 2022. And, during the Financial Crisis of 2007-2008 nearly all asset classes crashed together. So, diversification can certainly be helpful at times, but it’s obviously not a perfect solution and there are periods when even broad diversification will fail to preserve wealth.
Given the extreme damage a bear market can inflict on a portfolio, I’ve never thought “buy-and-hold” was an attractive investment strategy, particularly for retirees or investors nearing retirement. So, during my career, I have felt compelled to actively manage risk and do my best to protect portfolios during bear markets, while also having the goal of participating in the upside of the market to the fullest extent possible during bull markets.
I think I’ve done a good job navigating markets during my long career, but at what cost? Extreme levels of stress, uncertainty, and plenty of sleepless nights.
With the introduction of Buffer ETFs, I’ve finally found an investment vehicle that will give me, and more importantly, my clients, peace of mind. Buffer ETFs provide both downside protection and upside participation in the market – the best of both worlds.
If you want to participate in stock market gains, to a cap, but with a defined level of protection against losses, Buffer ETFs may be a perfect fit for your portfolio.
Buffer ETFs first started trading on U.S. exchanges with Innovator’s launch in 2018. Innovator repackaged the appeal of structured notes and annuities in an ETF wrapper. The ETFs offer downside protection and upside participation in the stock market, but without the typical disadvantages of structured products. The ETFs are liquid, transparent and tax efficient. It was brilliant.
I started tracking Buffer ETFs in 2020 because I thought they could be very attractive for my clients. Most of my clients are either retired or nearing retirement, so the idea of some level of downside protection was very appealing. My clients get plenty of downside protection and they can also participate in stock market gains, to a cap. The ETFs are liquid with no lock-up periods or surrender charges. It was indeed a very innovative idea.
I did a lot of research prior to investing and it took me a while to get comfortable with Buffer ETFs and to find an opportune time to invest. I interviewed employees and strategists at various leading Buffer ETF firms. I also interviewed sub-advisors of the ETFs. I wanted to talk to the individuals who actually managed the option strategies within the ETFs. The more I learned, the more comfortable I felt about investing for my clients.
During the market selloff in 2022, when both stocks and bonds were hit hard, I was focused on controlling risk for my clients. I had a lot of cash on hand in the fall of 2022 and I was considering where to reinvest. Valuations were decent, but stocks weren’t cheap and investors were pessimistic given how poorly the market had performed that year. I viewed the negative sentiment as healthy and I thought it could help stocks surprise to the upside in 2023. Still, I wasn’t willing to make an unhedged “bet” on the market – I wanted some protection.
I had been checking the upside cap levels of Innovator’s Buffer ETF offerings and was particularly intrigued by its 15% Power Buffer series as November approached. The market was already down nearly 20%, so adding another 15% layer of protection was very appealing to me. At that point, the additional “buffer” would basically protect my clients from a very deep peak-to-valley decline in the market.
The 20.5% upside cap for Innovator’s U.S. Equity Power Buffer ETF – November (PNOV is the trading symbol) on its reset date, October 31, 2022, was nearly the highest I had ever seen for a 15% Buffer ETF. PNOV offered 15% downside protection and my clients had the potential to make close to 20% during the 12-month outcome period. If the reference asset, the SPDR S&P 500 ETF Trust (SPY), performed well in 2023, my clients would participate nicely in the gains. And, if stocks had another bad year, my clients had plenty of protection in place. What’s not to like? I thought it was a tremendous risk vs. reward opportunity, so I went “all in.”
My first purchase of PNOV on October 31, 2022, and another purchase of Innovator’s U.S. Equity Power Buffer ETF – September (PSEP) the next day, represented the vast majority of my assets under management. I had no concern about entering sizeable orders in these ETFs due to the highly liquid underlying exposure in SPY. The bid-ask spreads were tight and execution on both trades through the institutional trading desk at TD Ameritrade was flawless.
Since my first dive into the Buffer ETF space, I’ve been extremely pleased with how the ETFs have performed. The returns have been in line with the defined outcome parameters indicated on the purchase dates, and they have performed with substantially less volatility than the market itself.
I love the fact that Buffer ETFs allow my clients to participate in stock market gains to a cap, but with a defined level of downside protection. Quite frankly, many of my clients may never want to invest again in the stock market without some level of downside protection.
“Buffer ETFs have ballooned in popularity”
-Bloomberg
“Buffer ETFs have become one of the fastest growing corners of the ETF market”
-Schwab Center for Financial Research
“…buffer ETFs draw billions amid jitters over market swings”
-The Wall Street Journal
“Buffer ETFs are booming”
-CNBC TV
“These ETFs promise protection in a down market. It’s working”
-Barron’s
“If you need downside protection, Buffer ETFs are having a moment”
-TheStreet
“Uncertain times drive record flow week for Innovator’s defined outcome ETFs”
-Pension & Investments
“Buffered ETFs make gains in Retirement Portfolios”
-Financial Times
“Buffer ETFs add ‘guard rails’ to uneasy equity markets”
-Investment News
“Buffer ETFs can limit losses in uncertain times”
-Kiplinger
“BlackRock launches its first buffer ETFs for stock-market investors
worried about a potential fall”
-MarketWatch
“Months after BlackRock’s debut, PGIM files to offer Buffer ETFs”
-Pension & Investments
“Volatile markets increase appeal of ETFs with a buffer”
-Financial Times
“Buffer ETFs Post 80% Surge in Assets as Haven in Bear Market”
–Bloomberg
“Buffered ETFs Grow as Investors Shun Risk”
-ETF.com
“How to cut your losses with Defined Outcome ETFs”
-Morningstar
“Buffered ETFs’ $10 billion Year”
-ETF.com
“How ‘Buffer’ ETFs Can Cushion a Major Market Selloff”
-Investopedia
“The Balancing Act: Buffer ETFs offer both Downside Protection and Growth Potential”
-Nasdaq.com
“Innovator launches 100% buffer ETF, calling it an industry first”
-Pension & Investments
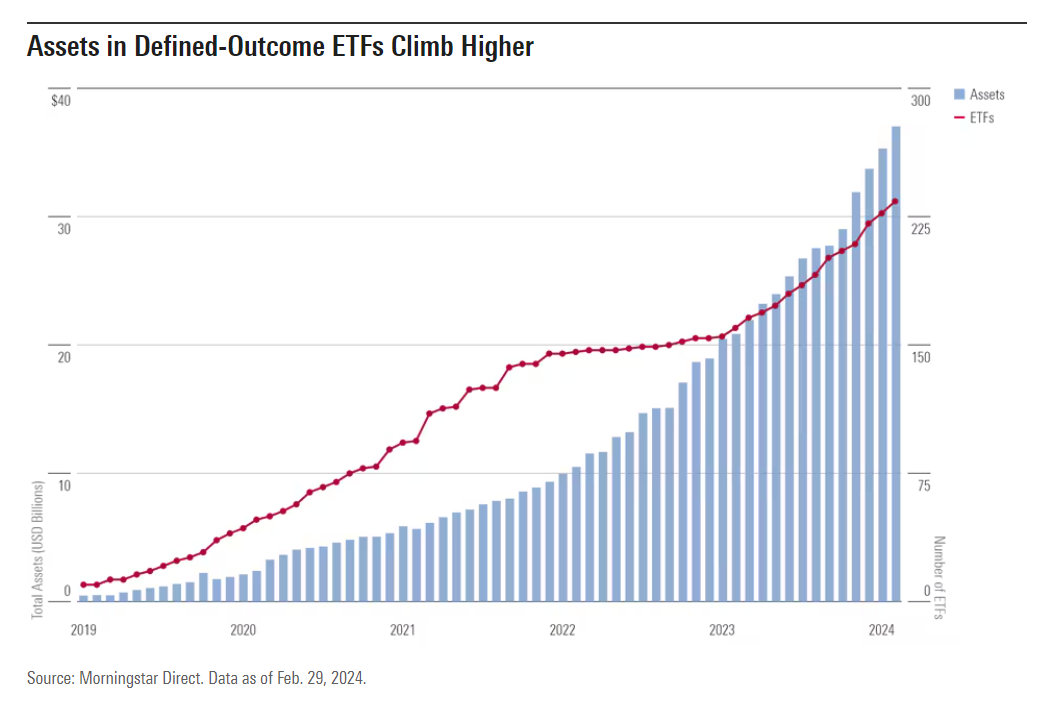
Buffer ETFs are one of the fastest growing segments of the ETF marketplace. According to Morningstar Direct, assets have grown from $200 million in 2018 to over $35 billion in 2024, and there are now over 200 Buffer ETFs trading on U.S. markets. Their popularity has skyrocketed.
Buffer ETFs are also sometimes referred to as Defined Outcome ETFs, Target Outcome ETFs, or Buffered ETFs, but they are all essentially the same investment vehicles. These ETFs track a stock market index over a defined outcome period while offering downside protection, known as a “buffer.”
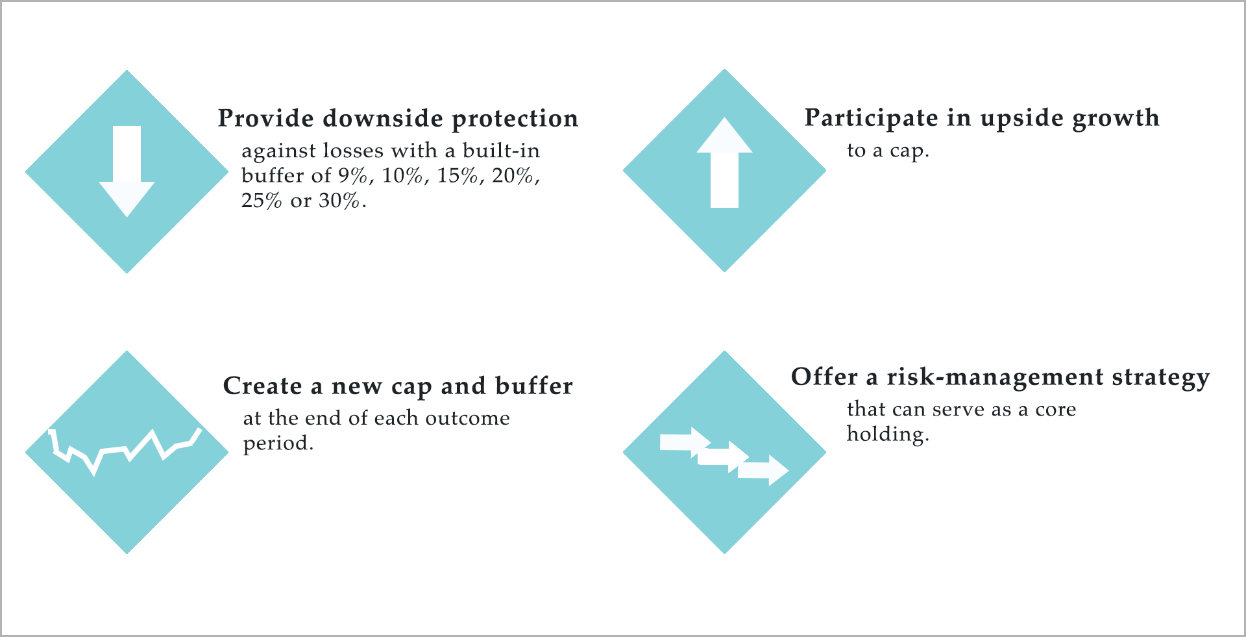
The appeal of Buffer ETFs is easy to understand. Investors love to participate in the upside of the stock market, but they don’t like risk. Buffer ETFs offer a potential solution by providing a defined level of downside protection while also allowing investors to participate in stock market gains, to a predetermined cap.
Typically, the buffer protects against the first loss of 9%, 10%, 15%, or 20%, depending on the Buffer ETF series you own. You can customize your portfolio and choose your desired buffer level over the outcome period, which is typically 12 months. There are also Buffer ETFs that reset quarterly or semi-annually.
Buffer ETFs don’t actually own stocks. They use options to track the performance of a major stock market index (e.g., S&P 500, Nasdaq-100, Russell 2000) to a cap, with built-in downside protection. Historically, defined outcome investments have only been available through certain banks and insurance companies. Now, you can invest in these strategies in a benefit-rich ETF wrapper.
If your investor profile matches one or more of the descriptions listed in this section, you will likely find Buffer ETFs very appealing.
You are a conservative or moderate-risk investor.
You are not interested in speculating in the stock market. You are looking for stable growth with reduced volatility and decreased risk of loss. With a built-in buffer against losses, Buffer ETFs should appeal to you if you do not want full downside risk exposure in the stock market.
You are a defensive-minded investor.
You are a defensive-minded investor more concerned about not losing money than hitting a home run. You would rather have a predetermined level of downside protection, and give up some upside potential, than have full downside exposure with no protection against losses.
You are a pre-retiree or retiree wanting to take reduced risk, but still participate in the upside of the stock market.
You are nearing retirement or already retired, but you still want to participate in the upside of the stock market. Buffer ETFs offer investors a safer way to participate in stock market gains, to a cap, with a predetermined level of downside protection.
You are relying on your assets in retirement and cannot afford the negative effects of deep market drawdowns.
You are nearing retirement or already retired and you want to greatly reduce the likelihood of large negative returns in your portfolio. This is more important to you than potentially missing out on high returns.
You are worried about a market correction or bear market and want protection in your portfolio.
You are concerned about a correction or bear market, so the protection provided by Buffer ETFs should appeal to you. You can choose your desired level of downside protection.
You are wary of investing at high stock market valuations.
You are worried about full downside loss exposure to stocks when valuations are high, but you still want to participate in the upside of the stock market, to a cap. You may find the potential outcome parameters offered by Buffer ETFs very attractive.
You are sitting on cash and want to get back into the stock market.
You have cash that you’d like to put to work in the stock market. Buffer ETFs offer a simple way to ease your portfolio back into the stock market, without full downside exposure to losses. Buffer ETFs can make allocating money in the stock market more comfortable with reduced risk.
You would like an alternative to bonds with the potential for higher returns.
You would like to own Buffer ETFs as a bond portfolio complement or replacement to have the potential for higher total returns.
You may own annuities or structured notes, but prefer the liquidity offered by Buffer ETFs.
You own annuities or structured notes that offer defined outcome strategies, but you prefer the liquidity provided by Buffer ETFs.
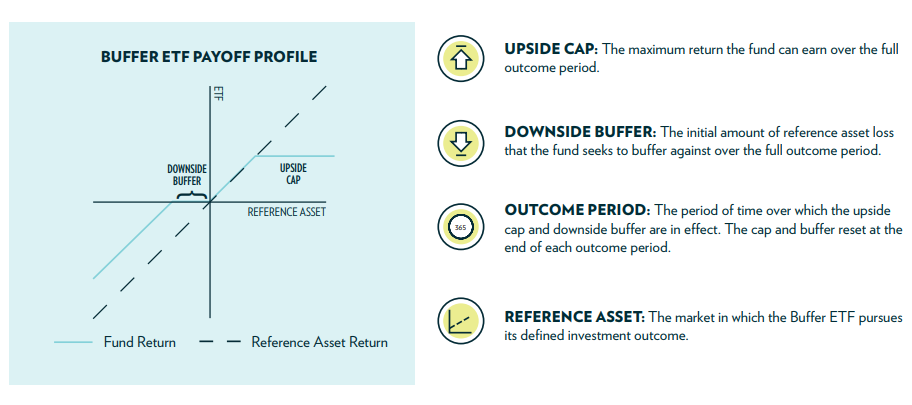
Buffer ETFs allow investors to reshape the return profile of an investment in the stock market. By accepting a limit on growth (upside cap), Buffer ETFs provide a built-in buffer against losses, over a defined outcome period. At the end of the outcome period, the ETFs automatically roll to a new outcome period, in a tax-efficient manner. On the reset date, the ETFs provide fresh downside protection and a new upside cap, making these investments suitable for long-term investors.
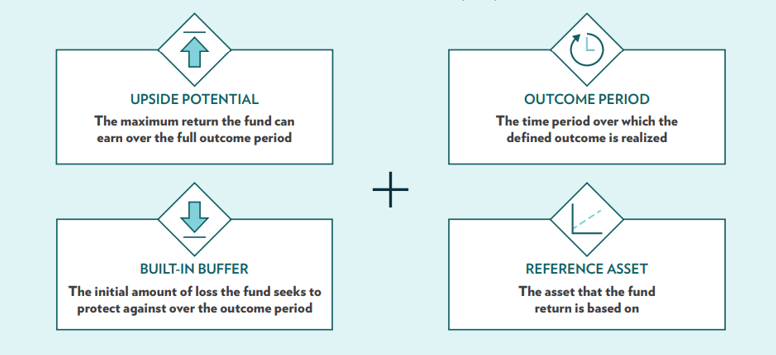
Four Key Components of Buffer ETFs:
1. Market Exposure: Buffer ETFs provide exposure to the price return of a major stock market index, to a cap.
2. Built-In Downside Protection: Buffer ETFs provide a defined buffer level to help limit losses.
3. ETF Wrapper: Buffer ETFs are packaged in an attractive exchange-traded fund wrapper.
4. Outcome Period: Buffer ETFs typically seek to deliver results over a one-year outcome period, at which point the ETFs automatically rebalance, in a tax-efficient manner, providing a fresh downside buffer and new upside cap.
Most investments today have uncertain levels of downside risk. Buffer ETFs allow investors to know their potential outcome parameters (downside risk and upside potential) prior to making a purchase, therefore reducing much of the uncertainty that comes with investing. This produces a number of key benefits for investors in an appealing ETF wrapper:
• Upside potential and downside risk are known prior to investing
• Have a known defined outcome
• Reduce market timing risk
• Set your own expectations and outcome parameters
• Remain invested for the long term
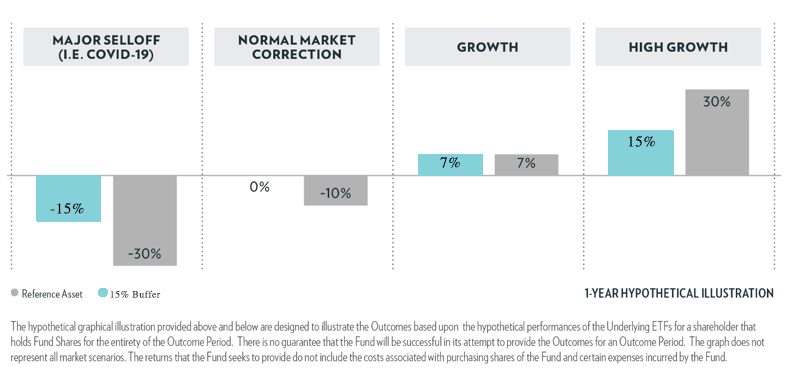
Potential Outcome Parameters
Buffer ETFs allow investors to know their return potential over a defined outcome period. In the chart you can see various hypothetical return scenarios (before fees) for a Buffer ETF with 15% downside protection and a 15% upside cap.
• Major Selloff: Reference asset finishes below the buffer
• Normal Market Correction: Reference asset finishes inside the buffer
• Growth: Reference asset finishes in positive territory, but below the cap
• High Growth: Reference asset finishes above the cap
Hypothetical Outcome Parameters: 15% Buffer & 15% Cap
A bear market is defined as a market decline of 20% or more. A bear market often coincides with a weakening economy, massive liquidation of securities, and widespread investor fear and pessimism. The shortest bear markets have lasted about three months (1987 and 1990). The longest bear market lasted three years, from 1946 to 1949. Taking the past 12 bear markets into consideration, the average length of a bear market is about 14 months.
The shallowest bear market loss took place in 1990, when the S&P 500 lost around 20%. The deepest bear market loss happened during the Financial Crisis of 2007-2008. The S&P 500 lost approximately 59% of its value in about 27 months. On average, in past bear markets, stocks have declined 34%.
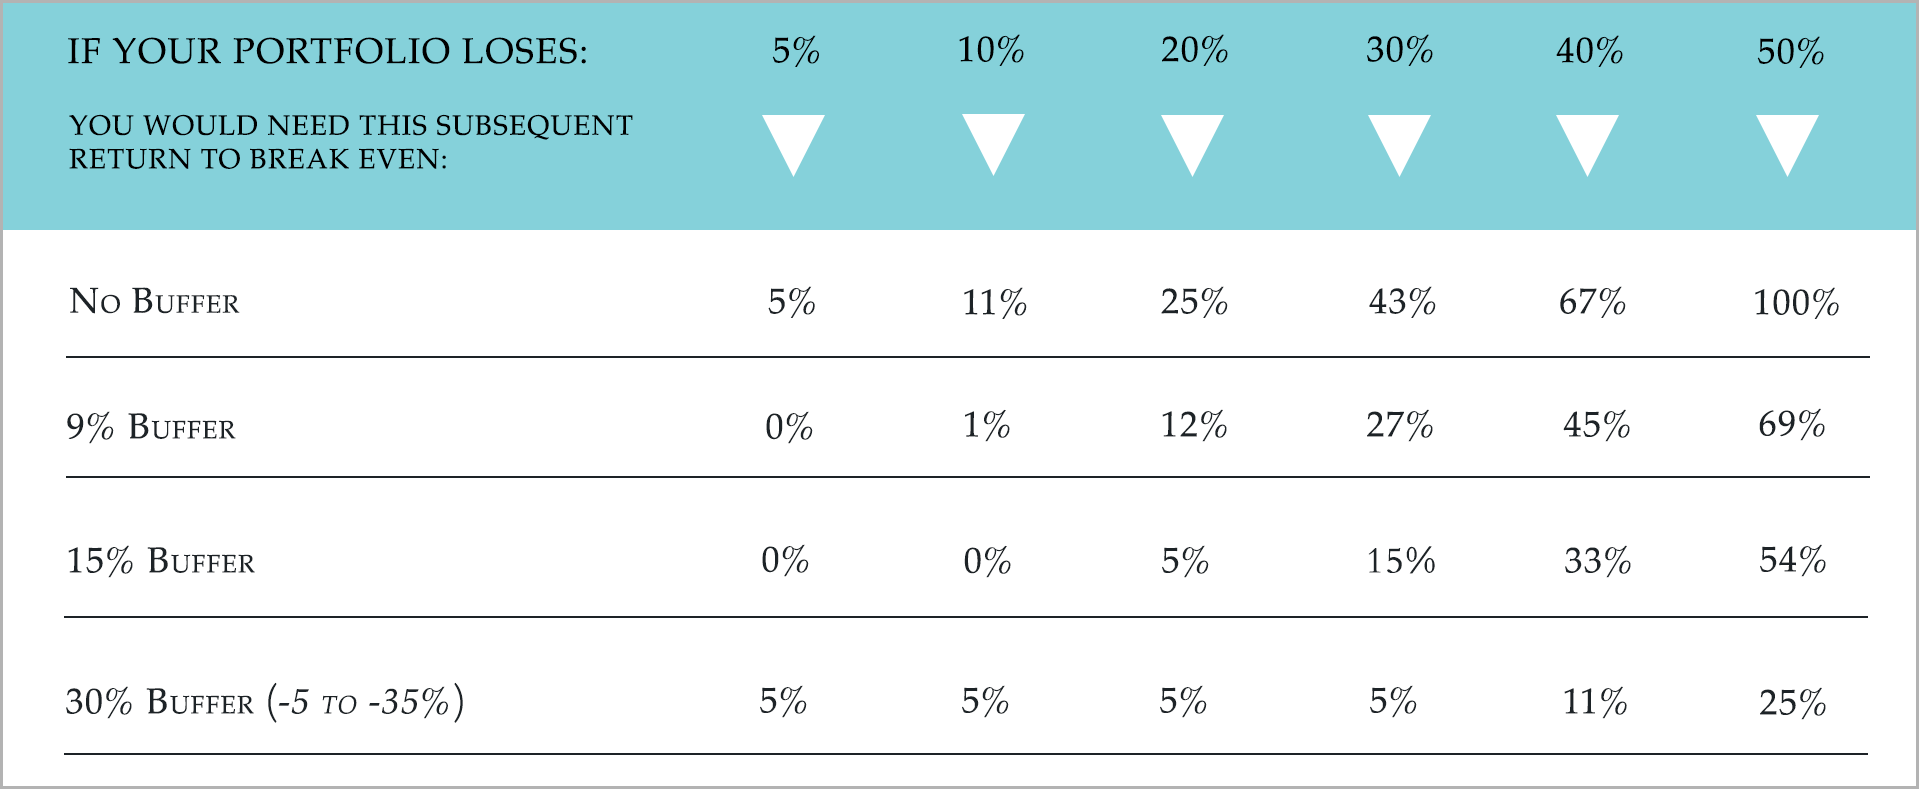
In a bear market, losing less with a built-in buffer can be powerful. Without a buffer, if your portfolio declines, it subsequently needs to gain more than it lost to get back to even. However, a portfolio with a buffer needs far less of a gain to recoup losses.
Losing Less with a Built-In Buffer
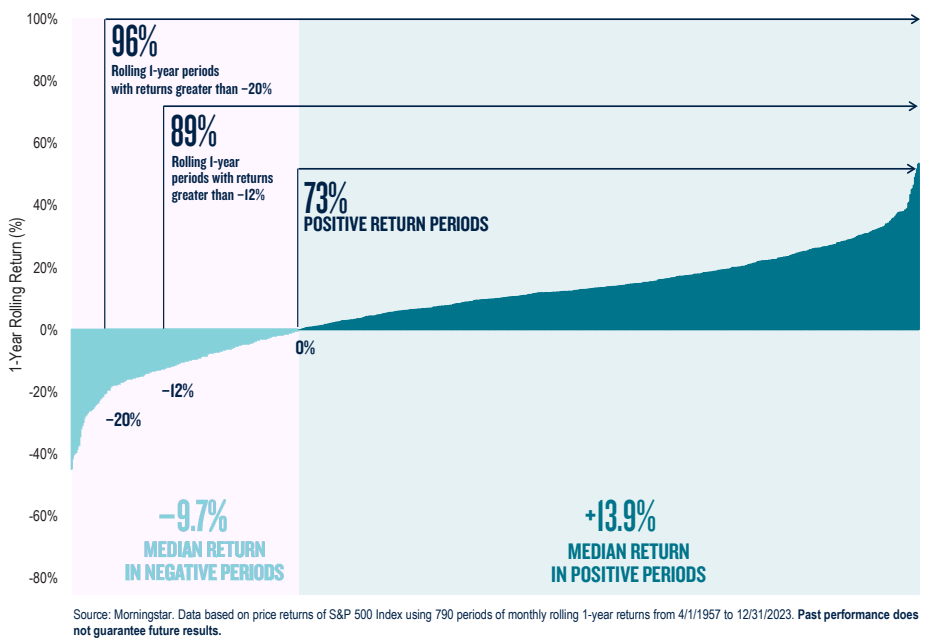
Buffer ETFs are offered for every month of the year, so it’s helpful to look at all historical rolling one-year return periods, in addition to calendar-year returns. As you can see in the graph, 73% of rolling one-year periods were positive. And, consider the following:
• 89% of rolling one-year period returns were better than -12%
• 96% of rolling one-year period returns were better than -20%
The median return during negative periods was -9.7% and the median return during positive periods was 13.9%.
Despite the fact that 73% of all rolling one-year periods since 1957 were positive, one cannot overstate the importance of “losing less” in declining markets. If history is a guide, Buffer ETFs that offer moderate downside protection should provide a sufficient level of protection to help mitigate losses in most market environments. Furthermore, Buffer ETFs that provide at least 15% to 20% downside protection should greatly reduce losses during the average bear market decline.
S&P 500 Rolling One-Year Returns (1957-2023)
During the past 66 years (1957-2023) there have only been three years (1974, 2002, 2008) when negative price returns of the S&P 500 exceeded 20%. And, there were only five years (1973, 1974, 2002, 2008, 2022) when negative returns of the S&P 500 exceeded 15%.
| Loss of more than -20% | Loss of -20% to -10% | Loss of -10% to 0% | |||
| Year | Index | Year | Index | Year | Index |
| 2002 | -23.37 | 2000 | -10.14 | 2011 | -0.003 |
| 1974 | -29.72 | 1969 | -11.36 | 2015 | -0.73 |
| 2008 | -39.49 | 1977 | -11.5 | 1994 | -1.54 |
| 1962 | -11.81 | 1960 | -2.97 | ||
| 2001 | -13.04 | 2018 | -6.24 | ||
| 1966 | -13.09 | 1990 | -6.56 | ||
| 1957 | -14.31 | 1981 | -9.73 | ||
| 1973 | -17.37 | ||||
| 2022 | -19.44 |
Buffer ETFs provide a defined level of protection against losses. You can also think of this as “insurance.” The insurance premium, or the cost of the protection, is having your return potential capped over the outcome period. The cost of the protection changes depending on market volatility and interest rates, which affect the upside caps.
Your preferred buffer level will depend on your risk profile and other factors. Do you want minimal, moderate, or deep protection? If you are very risk averse, you can even purchase total downside protection.
In normal market environments, I think the cost of protection is reasonable. For example, let’s say you purchase a 15% Buffer ETF series that offers upside participation in the S&P 500 to a cap of 14%. Any gain by the reference asset (SPY) beyond 14% during the outcome period will not be captured – it’s effectively forfeited. Your “cost” for the downside protection is having your upside potential capped over the 12-month outcome period. But, wouldn’t you typically be happy with a 14% annual return?
The downside protection allows you to buffer your position against the first 15% loss (before fees), over the outcome period, which in any market other than a bear market, would likely be enough protection to shield you from loss.
The appeal of Buffer ETFs, and the protection they provide, is all about the opportunity cost. If the upside cap is attractive, which to me would be a cap that is at least as high as the average annual historical return of the stock market (10%), then the protection is likely worth the cost. A 15% buffer provides protection against the first 15% decline in the reference asset, and that’s a lot of protection in nearly any market environment. If the potential upside is at least 10% net over the outcome period, then I think it’s worth considering a purchase.
Sure, the attractiveness of any Buffer ETF will depend on the market’s current trend and where we are in a market cycle. Are we in the middle of a bear market or are prices well into a bull-market run and valuations stretched? This could greatly influence how much protection you want or whether or not you want any protection at all. If valuations are high, or even in the normal historical range (16x P/E ratio for the S&P 500), I’d argue the protection is likely worth the cost. But, if we are in the throes of a bear market, and stocks are already trading down 20% or more, then you might not want any protection at that point. The opportunity cost (capped upside) could potentially be too expensive if the reference asset surges coming out of a steep decline.
Most of the investors I’ve talked to are very interested in the portfolio protection that Buffer ETFs provide, as long as the upside caps are equal to or higher than the average annual historical return of the U.S. stock market. Thankfully, in recent years, most Buffer ETFs have offered upside gross caps of 14% or more, with moderate downside protection of 15%. This is a pretty attractive risk vs. reward opportunity for most investors, and likely worth the cost of the protection.
Is the cost of having portfolio protection with Buffer ETFs worth it for you?
Your decision to purchase portfolio protection through Buffer ETFs should depend on your current outlook for the stock market, and more importantly, your tolerance for risk. If you are a conservative or moderate-risk investor, you may always want some level of downside protection in your stock portfolio. If you are an aggressive investor who can withstand a 30% decline (or more) in the value of your stock portfolio during a bear market, then you may decide you never want any protection because you don’t want to cap your upside return potential.
Buffer ETFs use options to pursue a defined investment outcome. Option prices move in response to movements in the reference asset, but are also sensitive to changes in market volatility and interest rates. The graphs in this section show how Buffer ETF prices can move in relation to their reference asset.
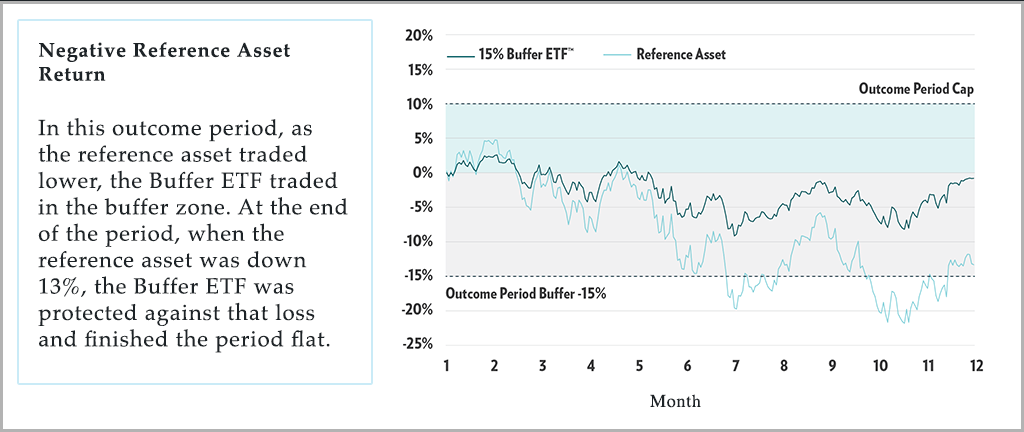
Negative Reference Asset Return
The first graph shows the hypothetical return of a 15% Buffer ETF relative to the reference asset, the SPDR S&P 500 ETF Trust (SPY). The ETF provided downside protection on the first 15% loss in the reference asset.
In this negative reference asset return scenario, as the reference asset traded lower, the ETF traded in the buffer zone. At the end of the outcome period, when the reference asset was down 13%, the Buffer ETF was protected against the loss and finished the period flat (before fees).
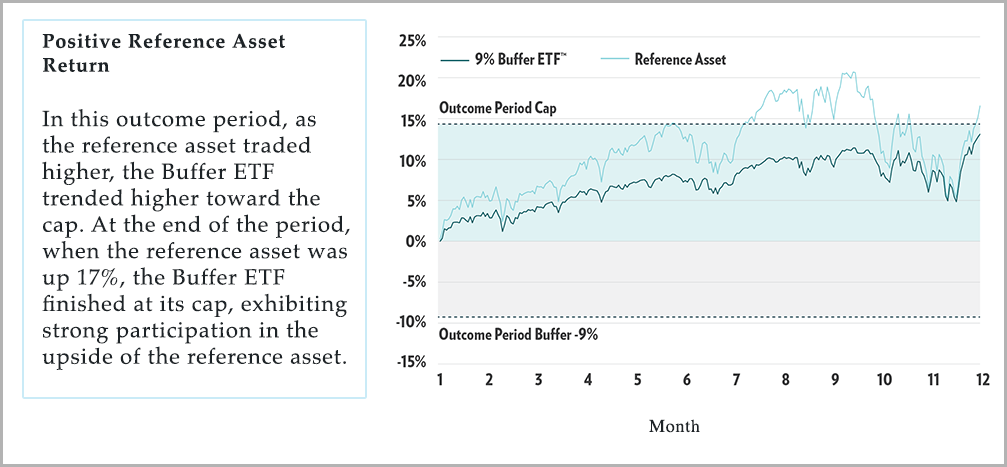
Positive Reference Asset Return
In this positive reference asset return scenario, the graph shows the hypothetical return of a 9% Buffer ETF relative to the reference asset, the SPDR S&P 500 ETF Trust (SPY). The ETF provided protection against the first 9% loss of the reference asset. Over the course of the outcome period, the ETF climbed to its cap while exhibiting less volatility than the reference asset.
In the outcome period, as the reference asset traded higher, the ETF trended higher toward the cap. At the end of the outcome period, when the reference asset was up 17%, the ETF finished at its cap, exhibiting participation in the upside of the reference asset.
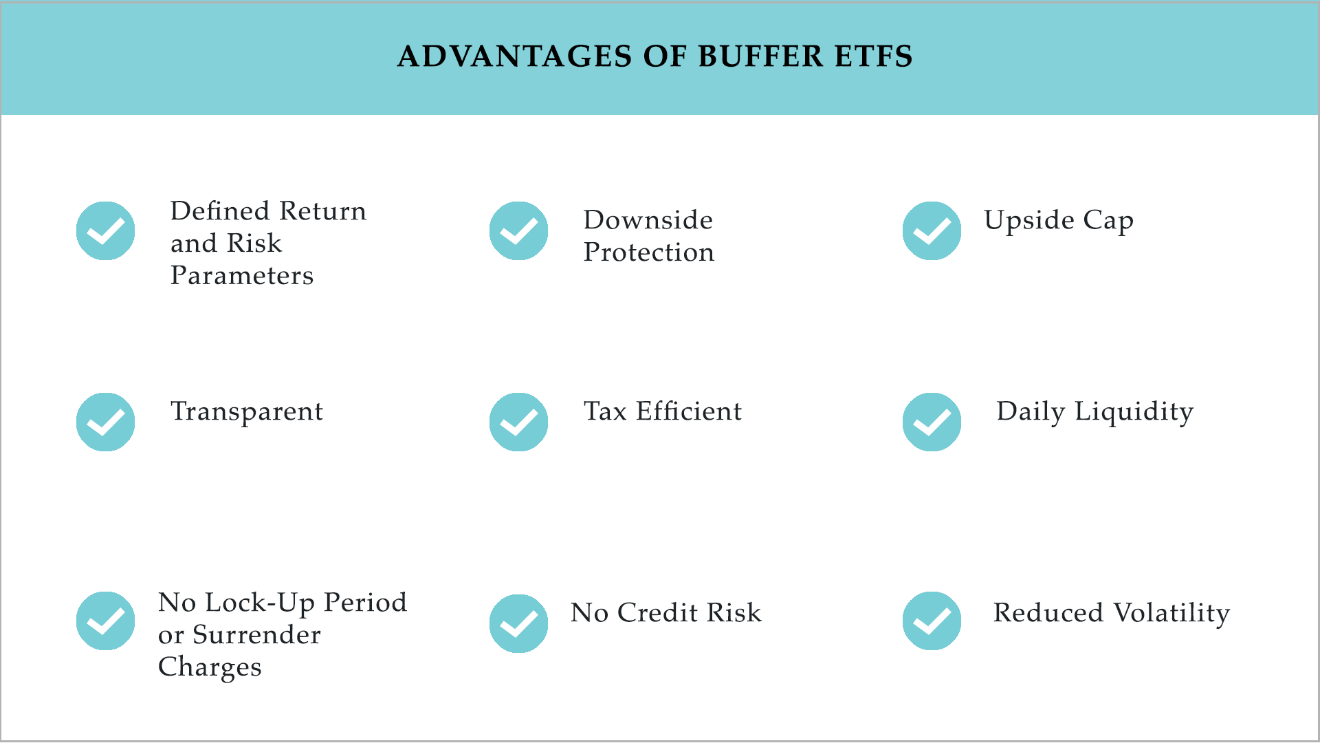
What are the advantages of owning Buffer ETFs?
• Buffer ETFs allow you to participate in the upside of the stock market, to a cap, but with downside protection.
• Buffer ETFs allow you to track a major stock market index (e.g., S&P 500, Nasdaq-100) with downside protection and an upside cap.
• Buffer ETFs allow you to track your chosen stock market index (reference asset) with less volatility than the reference asset.
• Buffer ETFs allow you to choose your level of downside protection based on your risk profile. There are Buffer ETFs that are appropriate for conservative, moderate, or aggressive investors.
• Buffer ETFs trade like stocks and other ETFs with daily liquidity and transparency.
• Buffer ETFs have no credit risk.
• Unlike many structured products, like annuities, Buffer ETFs have no lock-up periods or surrender charges.
• Buffer ETFs automatically reset at the end of the outcome period with a fresh buffer and new upside cap.
• Buffer ETFs are tax efficient. Thanks to the ETF wrapper, the resets are done in a tax-efficient manner.
• Buffer ETFs are suitable for both tax-deferred and taxable accounts.
• Buffer ETFs appeal to conservative and moderate-risk investors who are looking for stable growth, but with less volatility and decreased risk of loss.
• Buffer ETFs allow risk-averse investors the opportunity to participate in the stock market, but with much-needed downside protection.
• Buffer ETFs allow investors nearing retirement or already retired, the ability to still participate in the growth of the stock market, to a cap, but with protection.
• Buffer ETFs allow investors who are concerned about a bear market, a way to stay invested in the stock market, but with downside protection.
• Buffer ETFs allow investors to stay invested in the stock market even during times of high valuations and heightened risk.
• Buffer ETFs are a conservative way to allocate cash into the market without full downside exposure to losses. Buffer ETFs can make allocating money in the stock market more comfortable with reduced risk.
• Buffer ETFs offer a viable alternative to a traditional 60/40 stock-bond portfolio allocation, with the possibility of higher growth.
• Buffer ETFs allow you to greatly reduce the likelihood of large negative returns in your portfolio. For conservative or moderate-risk investors this is arguably much more important than potentially missing out on high returns.
• Buffer ETFs are an attractive, risk-managed, core portfolio holding, for long-term investors.
What are the disadvantages of owning Buffer ETFs?
There are not many disadvantages of owning Buffer ETFs, but they aren’t a perfect solution in every stock market environment. The risks are at the extremes. If you buy a Buffer ETF that offers 15% downside protection, but the reference asset tumbles 25% over the outcome period, you’ll lose the difference, or 10% (plus fees). And, if the reference asset soars coming out of a bear market, but your upside is capped, you could miss out on higher returns.
In my opinion, the most obvious time to have reduced exposure to Buffer ETFs, is if the stock market is already deep in bear market territory. If stock valuations are attractive, and the reference asset is already trading down 20% or more from its peak, you will likely not want to own Buffer ETFs. The reason is you don’t want to cap your upside after a steep downturn. Often stocks can skyrocket coming out of a bear market, so you will likely not want to have your potential returns capped at any level.
Note, with the recent launch of Allianz’s Uncapped Buffer ETFs, there are now enticing Buffer ETFs to consider when stock prices are depressed and trading at attractive valuations during bear markets. See the section on Uncapped Buffer ETFs for more details.
Is capping your upside return potential in exchange for downside protection the right decision for you?
You may question whether or not it makes sense to limit your upside return potential in order to have downside protection in your portfolio. The primary reason to accept a cap in exchange for downside protection is that you can greatly reduce the likelihood of large negative returns, and this is arguably much more important than potentially missing out on high positive returns. There is a strong case to be made for accepting this trade-off with Buffer ETFs, especially if you are relying on your assets in retirement and cannot afford the negative effects of deep market drawdowns.
If you are nearing retirement or already retired, you should seriously consider whether or not you can handle, from a financial perspective, deep losses in your portfolio that invariably will happen without some level of downside protection. If history is a guide, if you have an unhedged stock portfolio, your portfolio could lose at least 30% in a bear market. Calculate what that loss would look like in dollar terms for your portfolio. Can you truly afford the loss or will it adversely affect your lifestyle?
Bottom line, if you cannot afford to lose 30% or more in your stock portfolio during the next bear market, then please consider the advantages of investing in Buffer ETFs.
The three primary issuers of Buffer ETFs, Innovator, FT Vest (First Trust Vest), and Allianz, offer ETFs that provide various levels of downside protection while tracking well-known stock market indices. Pacer ETFs and BlackRock iShares also offer Buffer ETFs. PGIM, the global asset management business of Prudential Financial, has also recently entered the Buffer ETF space. Innovator offers the deepest lineup.
Buffer ETF offerings have surged over the past five years. The new offerings are welcome and they provide advisors and investors with more choices. The list of Buffer ETFs in this section is not intended to be comprehensive, but it does comprise most offerings from the primary issuers in the Buffer ETF marketplace.
Innovator Buffer ETFs
Emerging Markets Power Buffer – Reference Asset: EEM
Buffer: 15%, Outcome Period: 12 Months, Expense Ratio: 0.89%
EJAN Emerging Markets Power Buffer ETF – January
EAPR Emerging Markets Power Buffer ETF – April
EOCT Emerging Markets Power Buffer ETF – October
EJUL Emerging Markets Power Buffer ETF – July
International Developed Markets Power Buffer – Reference Asset: EFA
Buffer: 15%, Outcome Period: 12 Months, Expense Ratio: 0.85%
IJAN Intl Developed Power Buffer ETF – January
INOV Intl Developed Power Buffer ETF – November
IAPR Intl Developed Power Buffer ETF – April
ISEP Intl Developed Power Buffer ETF – September
IDEC Intl Developed Power Buffer ETF – December
IOCT Intl Developed Power Buffer ETF – October
IJUL Intl Developed Power Buffer ETF – July
U.S. Small Cap Power Buffer – Reference Asset: IWM
Buffer: 15%, Outcome Period: 12 Months, Expense Ratio: 0.79%
KJAN U.S. Small Cap Power Buffer ETF – January
KAPR U.S. Small Cap Power Buffer ETF – April
KOCT U.S. Small Cap Power Buffer ETF – October
KJUL U.S. Small Cap Power Buffer ETF – July
Nasdaq-100 Index Power Buffer – Reference Asset: QQQ
Buffer: 15%, Outcome Period: 12 Months, Expense Ratio: 0.79%
NJAN Growth-100 Power Buffer ETF – January
NAPR Growth-100 Power Buffer ETF – April
NOCT Growth-100 Power Buffer ETF – October
NJUL Growth-100 Power Buffer ETF – July
Innovator U.S. Equity Buffer – Reference Asset: SPY
Buffer: 9%, Outcome Period: 12 Months, Expense Ratio: 0.79%
BJAN Buffer 9% – January
BFEB Buffer 9% – February
BMAR Buffer 9% – March
BAPR Buffer 9% – April
BMAY Buffer 9% – May
BJUN Buffer 9% – June
BJUL Buffer 9% – July
BAUG Buffer 9% – August
BSEP Buffer 9% – September
BOCT Buffer 9% – October
BNOV Buffer 9% – November
BDEC Buffer 9% – December
Innovator U.S. Equity Power Buffer – Reference Asset: SPY
Buffer: 15%, Outcome Period: 12 Months, Expense Ratio: 0.79%
PJAN Power Buffer 15% – January
PFEB Power Buffer 15% – February
PMAR Power Buffer 15% – March
PAPR Power Buffer 15% – April
PMAY Power Buffer 15% – May
PJUN Power Buffer 15% – June
PJUL Power Buffer 15% – July
PAUG Power Buffer 15% – August
PSEP Power Buffer 15% – September
POCT Power Buffer 15% – October
PNOV Power Buffer 15% – November
PDEC Power Buffer 15% – December
Innovator U.S. Equity Ultra Buffer – Reference Asset: SPY
Buffer: 30% (-5% to -35%), Outcome Period: 12 Months, Expense Ratio: 0.79%
UJAN Ultra Buffer 30% – January
UFEB Ultra Buffer 30% – February
UMAR Ultra Buffer 30% – March
UAPR Ultra Buffer 30% – April
UMAY Ultra Buffer 30% – May
UJUN Ultra Buffer 30% – June
UJUL Ultra Buffer 30% – July
UAUG Ultra Buffer 30% – August
USEP Ultra Buffer 30% – September
UOCT Ultra Buffer 30% – October
UNOV Ultra Buffer 30% – November
UDEC Ultra Buffer 30% – December
Innovator Equity Defined Protection Buffer – Reference Asset: SPY
Buffer: 100%, Outcome Period: 24 Months, Expense Ratio: 0.79%
TJUL Equity Defined Protection 100% – July 2025 (7/18/2023 – 6/30/2025)
AJAN Equity Defined Protection 100% – January 2026 (1/1/2024) – 12/31/2025)
AAPR Equity Defined Protection 100% – April 2026 (4/1/2024 – 3/31/2026)
BALT: Defined Wealth Shield – Reference Asset: SPY
Quarterly Buffer: 20%, Expense Ratio: 0.69%
ZALT: Defined Wealth Shield – Reference Asset: SPY
Quarterly Buffer: 10%, Expense Ratio: 0.69%
Innovator Managed Buffer Step-Up Strategy ETFs – Reference Asset: SPY
Expense Ratio: 0.89%
BSTP 9% Managed Buffer Step-Up Strategy
PSTP 15% Managed Buffer Step-Up Strategy
Innovator Laddered Buffer ETFs – Reference Asset: SPY
Expense ratio: 0.89%
BUFB 9% Laddered Buffer Strategy
BUFF 15% Laddered Buffer Strategy
Innovator U.S. Equity Accelerated 9 Buffer ETF – Reference Asset: SPY
Buffer: 9%, Outcome Period: 12 Months, Expense Ratio: 0.79%
XBJA 9% Buffer – January
XBAP 9% Buffer – April
XBJL 9% Buffer – July
XBOC 9% Buffer – October
FT Vest Target Outcome ETFs
International Developed Markets Moderate Buffer – Reference Asset: EFA
Buffer: 15%, Outcome Period: 12 Months, Expense Ratio: 0.90%
YDEC Moderate Buffer 15% – December
YJUN Moderate Buffer 15% – June
YMAR Moderate Buffer 15% – March
YSEP Moderate Buffer 15% – September
U.S. Small Cap Moderate Buffer – Reference Asset: IWM
Buffer: 15%, Outcome Period: 12 Months, Expense Ratio: 0.90%
SAUG Moderate Buffer 15% – August
SMAY Moderate Buffer 15% – May
SNOV Moderate Buffer 15% – November
Nasdaq-100 Index Buffer – Reference Asset: QQQ
Buffer: 10%, Outcome Period: 12 Months, Expense Ratio: 0.90%
QDEC Buffer 10% – December
QJUN Buffer 10% – June
QMAR Buffer 10% – March
QSPT Buffer 10% – September
Nasdaq-100 Index Conservative Buffer – Reference Asset: QQQ
Buffer: 20%, Outcome Period: 12 Months, Expense Ratio: 0.90%
QCAP Buffer 20% – April
FT Vest U.S. Equity Buffer – Reference Asset: SPY
Buffer: 10%, Outcome Period: 12 Months, Expense Ratio: 0.85%
FJAN Buffer 10% – January
FFEB Buffer 10% – February
FMAR Buffer 10% – March
FAPR Buffer 10% – April
FMAY Buffer 10% – May
FJUN Buffer 10% – June
FJUL Buffer 10% – July
FAUG Buffer 10% – August
FSEP Buffer 10% – September
FOCT Buffer 10% – October
FNOV Buffer 10% – November
FDEC Buffer 10% – December
FT Vest U.S. Equity Moderate Buffer – Reference Asset: SPY
Buffer: 15%, Outcome Period: 12 Months, Expense Ratio: 0.85%
GJAN Moderate Buffer 15% – January
GFEB Moderate Buffer 15% – February
GMAR Moderate Buffer 15% – March
GAPR Moderate Buffer 15% – April
GMAY Moderate Buffer 15% – May
GJUN Moderate Buffer 15% – June
GJUL Moderate Buffer 15% – July
GAUG Moderate Buffer 15% – August
GSEP Moderate Buffer 15% – September
GOCT Moderate Buffer 15% – October
GNOV Moderate Buffer 15% – November
GDEC Moderate Buffer 15% – December
FT Vest U.S. Equity Deep Buffer – Reference Asset: SPY
Buffer: 25% (-5% to -30%), Outcome Period: 12 Months, Expense Ratio: 0.85%
DJAN Deep Buffer 25% – January
DFEB Deep Buffer 25% – February
DMAR Deep Buffer 25% – March
DAPR Deep Buffer 25% – April
DMAY Deep Buffer 25% – May
DJUN Deep Buffer 25% – June
DJUL Deep Buffer 25% – July
DAUG Deep Buffer 25% – August
DSEP Deep Buffer 25% – September
DOCT Deep Buffer 25% – October
DNOV Deep Buffer 25% – November
DDEC Deep Buffer 25% – December
FT Vest Funds of Target Outcome Funds
Expense Ratios: 1.05% – 1.10%
BUFQ FT Vest Fund of Nasdaq-100 Buffer ETFs – Reference Asset: QQQ
BUFR FT Vest Fund of Buffer ETFs – Reference Asset: SPY
BUFZ FT Vest Laddered Moderate Buffer ETFs – Reference Asset: SPY
BUFD FT Vest Fund of Deep Buffer ETFs – Reference Asset: SPY
BUFT FT Vest Buffered Allocation Defensive ETF – Reference Asset: SPY
BUFG FT Vest Buffered Allocation Growth ETF – Reference Asset: SPY
FT Vest U.S. Equity Enhance & Moderate Buffer ETF – Reference Asset: SPY
Buffer: 15%, Outcome Period: 12 Months, Expense Ratio: 0.85%
XJAN 15% Enhance & Moderate Buffer – January
XFEB 15% Enhance & Moderate Buffer – February
XMAR 15% Enhance & Moderate Buffer – March
XAPR 15% Enhance & Moderate Buffer – April
XMAY 15% Enhance & Moderate Buffer – May
XJUN 15% Enhance & Moderate Buffer – June
XJUL 15% Enhance & Moderate Buffer – July
XAUG 15% Enhance & Moderate Buffer – August
XSEP 15% Enhance & Moderate Buffer – September
XOCT 15% Enhance & Moderate Buffer – October
XNOV 15% Enhance & Moderate Buffer – November
XDEC 15% Enhance & Moderate Buffer – December
FT Vest U.S. Equity Max Buffer ETF – Reference Asset: SPY
Buffer: 100%, Outcome Period: 12 Months, Expense Ratio: 0.85%
MAMR FT Vest U.S. Equity Max Buffer 100% – March (3/27/2024 – 3/21/2025)
AllianzIM Buffered ETFs
AllianzIM Buffer 10 Series – Reference Asset: SPY
Buffer: 10%, Outcome Period: 12 Months, Expense Ratio: 0.74%
JANT Buffer 10% – January
FEBT Buffer 10% – February
MART Buffer 10% – March
APRT Buffer 10% – April
MAYT Buffer 10% – May
JUNT Buffer 10% – June
JULT Buffer 10% – July
AUGT Buffer 10% – August
SEPT Buffer 10% – September
OCTT Buffer 10% – October
NOVT Buffer 10% – November
DECT Buffer 10% – December
AllianzIM Buffer 20 Series – Reference Asset: SPY
Buffer: 20%, Outcome Period: 12 Months, Expense Ratio: 0.74%
JANW Buffer 20% – January
FEBW Buffer 20% – February
MARW Buffer 20% – March
APRW Buffer 20% – April
MAYW Buffer 20% – May
JUNW Buffer 20% – June
JULW Buffer 20% – July
AUGW Buffer 20% – August
SEPW Buffer 20% – September
OCTW Buffer 20% – October
NVBW Buffer 20% – November
DECW Buffer 20% – December
AllianzIM 6-Month Buffer 10 Series – Reference Asset: SPY
Buffer: 10%, Outcome Period: 6 Months, Expense Ratio: 0.74%
SIXJ AllianzIM U.S. Large Cap 6-Month Buffer 10 Jan/Jul
SIXF AllianzIM U.S. Large Cap 6-Month Buffer 10 Feb/Aug
SIXP AllianzIM U.S. Large Cap 6-month Buffer 10 Mar/Sep
SIXO AllianzIM U.S. Large Cap 6-Month Buffer 10 Apr/Oct
SIXZ AllianzIM U.S. Large Cap 6-Month Buffer 10 May/Nov*
SIXD AllianzIM U.S. Large Cap 6-Month Buffer 10 June/Dec*
*SIXZ and SIXD are anticipated to launch in May and June 2024.
AllianzIM Uncapped Buffered ETFs – Reference Asset: SPY
Buffer: 15%, Outcome Period: 12 Months, Expense Ratio: 0.74%
ARLU 15% Buffer – U.S. Equity Buffer 15 Uncapped – April*
*Allianz will issue an Uncapped Buffer ETF for every month of the year.
PGIM Buffer ETFs
PGIM U.S. Large-Cap Buffer 12 Series – Reference Asset: SPY
Buffer: 12%, Outcome Period: 12 Months, Expense Ratio: 0.50%
JANP Buffer 12% – January
FEBP Buffer 12% – February
MRCP Buffer 12% – March
APRP Buffer 12% – April*
MAYP Buffer 12% – May*
JUNP Buffer 12% – June*
JULP Buffer 12% – July*
AUGP Buffer 12% – August*
SEPP Buffer 12% – September*
OCTP Buffer 12% – October*
NOVP Buffer 12% – November*
DECP Buffer 12% – December*
PGIM U.S. Large-Cap Buffer 20 Series – Reference Asset: SPY
Buffer: 20%, Outcome Period: 12 Months, Expense Ratio: 0.50%
PBJA Buffer 20% – January
PBFB Buffer 20% – February
PBMR Buffer 20% – March
PBAP Buffer 20% – April*
PBMY Buffer 20% – May*
PBJN Buffer 20% – June*
PBJL Buffer 20% – July*
PBAU Buffer 20% – August*
PBSE Buffer 20% – September*
PBOC Buffer 20% – October*
PBNV Buffer 20% – November*
PBDE Buffer 20% – December*
*April – December series will be launched throughout 2024.
Pacer Swan SOS ETFs
Pacer Swan SOS Buffer Moderate Series – Reference Asset: SPY
Buffer: 15%, Outcome Period: 12 Months, Expense Ratio: 0.60%
PSMO Buffer 15% – October
PSMJ Buffer 15% – July
PSMD Buffer 15% – January
PSMR Buffer 15% – April
Pacer Swan SOS Buffer Conservative Series – Reference Asset: SPY
Buffer: 25% (-5% to -30%), Outcome Period: 12 Months, Expense Ratio: 0.60%
PSCQ Buffer 25% – October
PSCJ Buffer 25% – July
PSCX Buffer 25% – January
PSCW Buffer 25% – April
Pacer Swan SOS Fund of Funds – Reference Asset: SPY
Expense Ratio: 0.72%
PSFF Pacer Swan SOS Fund of Funds ETF
BlackRock iShares Buffer ETFs – Reference Asset: IVV
Quarterly Buffer, Expense Ratio: 0.50%
IVVM: Buffer 5%, iShares Large Cap Moderate Buffer ETF
IVVB: Buffer 15% (-5% to -20%), iShares Large Cap Deep Buffer ETF