 img-buffer-etfs1-4
It’s imperative to know the potential outcome parameters prior to purchasing a Buffer ETF. If you are purchasing a Buffer ETF intra-outcome period (any day other than the reset day), the outcome parameters will have changed from the reset date. Thankfully, the outcome parameters for all the offerings from Innovator, FT Vest, and Allianz are updated throughout each trading day on their websites.
Let’s look at the potential outcome parameters for three Innovator U.S. Equity Power Buffer ETFs (15% downside protection) as shown on Innovator’s website on November 22, 2023. This should help you better understand how to make an intelligent intra-outcome purchase.
| Ticker | Asset -30% | Asset -20% | Asset -15% | Asset -10% | Asset -5% | Asset Flat | Asset +5% | Asset +10% | Asset +15% | Asset +20% | Asset +30% |
| PAUG | -16.38% | -6.55% | -1.63% | -1.35% | -1.35% | -1.35% | 3.23% | 8.15% | 13.06% | 13.66% | 13.66% |
| PSEP | -16.04% | -6.14% | -2.27% | -2.27% | -2.27% | -0.99% | 3.96% | 8.91% | 12.36% | 12.36% | 12.36% |
| PJUL | -15.83% | -5.88% | -3.31% | -3.31% | -3.31% | -0.48% | 4.50% | 9.47% | 10.50% | 10.50% | 10.50% |
The table compares the potential outcome parameters for Innovator’s U.S. Equity Power Buffer series (15% protection) for the July, August, and September series (PJUL, PAUG and PSEP). The reference asset is the S&P 500 (SPY).
When comparing these three Buffer ETFs, it’s of primary concern to first determine how much downside protection remains from the original 15% protection that was available on the most recent reset date. You can see that if the SPY’s return is break even (“Asset Flat”), for the remainder of the outcome period, PAUG will lose 1.35%, PSEP will decline 0.99% and PJUL will lose 0.48%.
Now, look at the column titled “Asset -15%.” This column shows you how much you would lose if SPY (“Asset”) declines 15% from the date of your purchase on November 22, 2023 to the end of the outcome period. PAUG offers the most protection if SPY were to decline 15% at the end of the outcome period – you would only lose 1.63%. PJUL would lose 3.31% if SPY was down 15% from the current price level at the end of the outcome period, and PSEP would decline 2.27%.
Note, obviously with a 15% buffer, you don’t have protection beyond the first 15% loss, so if the reference asset lost 20%, for example, during the remainder of the outcome period, PAUG would lose 6.55%, PSEP would drop 6.14%, and PJUL would decline 5.88%.
On the positive side of the ledger, to the right of the column titled “Asset Flat,” you can see how the Buffer ETFs will perform if the reference asset appreciates from November 22 to the end of the outcome period. For example, if SPY is up 10%, PAUG would gain 8.15%, PSEP 8.91%, and PJUL 9.47%. The upside performance for all three ETFs is capped around the 15% return level of the reference asset. If SPY is up 15% during the remaining outcome period, PAUG would gain 13.06%, PSEP 12.36%, and PJUL 10.5%.
Any gains of the reference asset beyond 15% are effectively forfeited (upside is capped during the outcome period). For example, SPY could jump 30%, but your return would be capped out at 13.66% for PAUG. This is the potential price you pay for having downside protection.
| Ticker | Reference Asset | ETF Return | Asset Return | Return Difference | Asset Return to Cap | Remaining Cap | Downside Before Buffer | Remaining Days |
| PAUG | SPY | 0.57% | -0.34% | 0.91% | 15.61% | 13.66% | -1.36% | 252 |
| PSEP | SPY | 1.52% | 1.31% | 0.21% | 13.48% | 12.36% | -2.29% | 283 |
| PJUL | SPY | 2.60% | 2.93% | -0.32% | 11.03% | 10.50% | -3.33% | 221 |
The columns in the table provide more important information to consider prior to making an intra-outcome Buffer ETF purchase. Let’s define each column.
“Ticker” refers to the trading symbol of the Buffer ETF.
“Reference Asset” refers to the underlying asset the Buffer ETF will track during the outcome period.
“ETF Return” shows the percentage the Buffer ETF has made or lost since the most recent reset date.
“Asset Return” shows the percentage return of the underlying asset (SPY) since the most recent reset date.
“Return Difference” is the percentage difference in performance between the underlying asset and the Buffer ETF.
“Asset Return to Cap” refers to how much the underlying asset (SPY) would have to appreciate to reach the upside cap.
“Remaining Cap” refers to the maximum amount of percentage gain the Buffer ETF owner could make in the remaining outcome period, before you reach the upside cap.
“Downside Before Buffer” refers to how much an investor could lose (percentage loss), from the current price level of the Buffer ETF, before the Buffer ETF’s “protection” kicks in.
Remember, if you own a Buffer ETF that is showing a profit since the prior reset date, or you are considering buying a Buffer ETF that already shows a gain in the new outcome period, that gain is unprotected. If the Buffer ETF subsequently declines, you could lose money before the buffer actually helps you (“Downside Before Buffer”). For example, if the Buffer ETFs in the table decline during the remainder of the outcome period, you could lose 1.36% in PAUG, 2.29% in PSEP, and 3.33% in PJUL before the buffer starts to protect against losses.
“Remaining Days” is the number of days remaining before the next reset date.
Summary
When comparing the potential outcome parameters for the three Innovator U.S. Equity Power Buffer ETFs, PAUG, PSEP, and PJUL on November 22, 2023, PAUG is probably the most attractive. It has 252 days remaining in the outcome period, which is much less than a newly reset Buffer that has 365 days remaining to the next reset date. Its upside cap (13.66%) is the highest of the three Buffer ETFs, and it also provides the most protection if the reference asset were to decline by 15%. It would only lose 1.63% while the other two would decline 2.27% and 3.31%, respectively. Overall, PAUG offers an attractive risk-reward profile with a relatively short outcome period, which makes it a potentially compelling intra-outcome purchase.
The ability to buy and sell Buffer ETFs throughout the outcome period introduces some attractive applications. This includes the ability to capture gains at any point during the outcome period. One should consider the benefits of rotating from one Buffer ETF to another.
Stepping up to a new Buffer series allows an investor to:
• Expand the upside cap
• Obtain a fresh downside buffer
• Eliminate downside-before-buffer risk
Up-Market Scenario
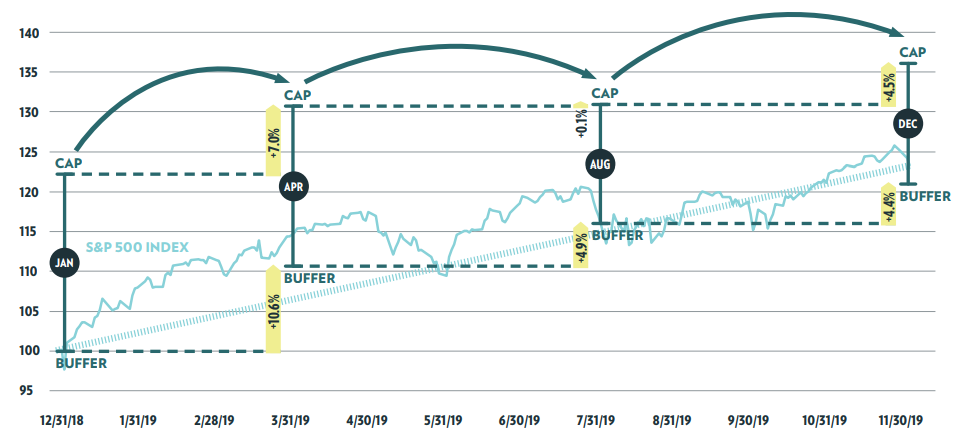
The graph illustrates the starting buffer and cap levels of various Innovator Buffer ETFs. In rising markets, “stepping up” into a new Buffer series may be a beneficial approach to locking in gains, expanding upside potential and resetting the buffer level at the same time. This is possible because of the monthly issuance of Buffer ETFs.
The resetting of a buffer means a new full downside buffer can be achieved and this allows an investor to hedge against the next 15% loss, for example.
The hypothetical graph highlights how an investor could use the January series to achieve an approximate 10% return, then roll into the April series. Doing so would expand the cap (7% from the original cap) as well as reset the buffer at a new, higher level. Moving from the April to the August series expands the cap by only 0.1%, but since the April series has appreciated approximately 5%, this sets the new buffer at a 5% higher level. This type of rotation, through the liquidity of Buffer ETFs, allows an investor to expand upside caps while resetting downside buffers at higher levels.
Step-Up Strategy
Down-Market Scenario
Conversely, an investor may identify opportunities to “step down” after the reference asset has declined. For example, if the reference asset (SPY) has retreated and the Buffer ETF has outperformed (lost less than the reference asset), this provides an opportunity for an investor to rotate into a Buffer ETF with less protection (e.g., rotate from a 15% buffer to a 9% buffer). This move would reset an investor’s buffer level, provide an additional 9% downside protection, and also increase the upside potential (higher cap) should the market begin to rally.
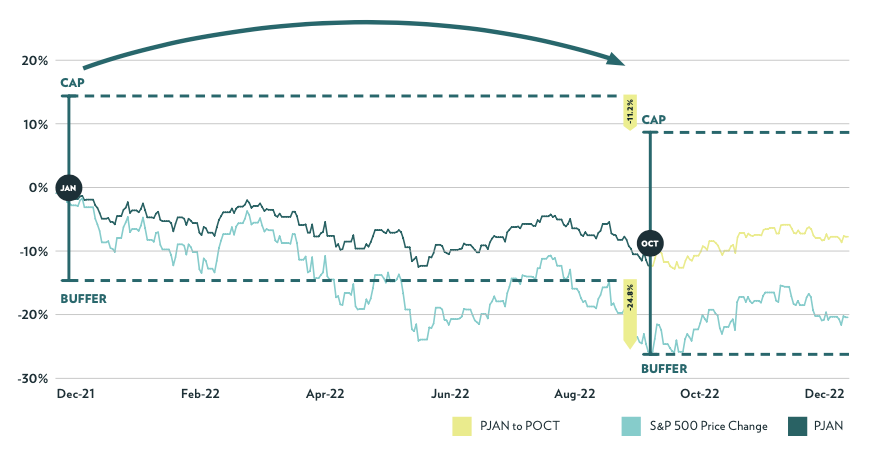
An example of a potentially attractive step-down strategy can be seen in the hypothetical graph. Let’s assume an investor purchased PJAN (Innovator U.S. Equity Power Buffer – January) on its reset date at the start of 2022. It provided downside protection against the first 15% loss of the reference asset, with an upside cap of 9%. By October, SPY had declined a whopping 24.8%, but PJAN had declined only 11.2%. This outperformance gave the investor the opportunity to: 1) rotate into a Buffer ETF with less protection (9% series) and a higher upside cap with better appreciation potential, or 2) rotate into another Buffer ETF with the same level of downside protection (15%), but with better upside potential (higher cap) over the next 12 months.
The graph shows a hypothetical rotation out of PJAN and into POCT, which created additional downside protection of 15% from the current price level of the reference asset. It also provided an attractive new upside cap. The volatility in the market had pushed caps higher during 2022, and POCT offered a very high gross cap of 20.7% on its reset date.
Both strategies could have been considered by a PJAN shareholder: 1) rotate into a 9% Buffer ETF, or 2) rotate into a 15% Buffer ETF. The choice likely would have depended on how much more downside risk the investor thought there could be in the reference asset below its current decline of 24%. The risk-averse investor would have likely opted for another 15% protective buffer, despite the market’s already steep decline. Regardless, both strategies provided additional downside protection with fresh buffers, as well as high upside caps, to hopefully recoup losses and profit in a rebounding market.
Step-Down Strategy
Locking in Profits during the Intra-Outcome Period
Let’s look at an example using the potential outcome parameters shown on June 16, 2023, for Innovator U.S. Equity Power Buffer – November (PNOV). Should an investor consider locking in profits on PNOV, 137 days before the end of the outcome period?
| ETF Ticker | ETF Name | Series | Index Ticker | ETF Price | ETF Return | Index Price | Index Return | Return Difference | Index Return To Cap | Remaining Cap | Down Before Buffer | Remaining Days |
| PNOV | Power Buffer | November | SPY | 33.63 | 12.04% | 439.46 | 13.79% | -1.75% | 5.91% | 7.03% | -11.24% | 137 |
The table shows the potential outcome parameters for PNOV. It offered a very compelling intra-outcome opportunity. PNOV had already gained 12.04% from the most recent reset date – that’s a pretty stellar return over an approximate 7-month period. However, all the gains were unrealized and at risk for the remainder of the outcome period. Obviously, we know that predicting stock market performance over a short time horizon is nearly impossible, so there is a real risk of losing these unrealized profits by the end of the outcome period. What we do know is, if we had purchased PNOV on the prior reset date (October 31, 2022), we had a very attractive unrealized gain that was at risk. Unrealized gains can quickly turn into losses in volatile markets.
A sale of PNOV on June 16 would have protected the 12.04% profit and removed the uncertainty of remaining invested for the balance of the outcome period.
Another reason to have considered a sale of PNOV was the fact that PNOV only offered another 7.03% upside potential (“Remaining Cap”). So, the investor knew the profit potential would be capped at 7.03% over the remaining 137 days. That’s still an attractive return, but not as high as the upside cap of PJUL on its upcoming reset date. By selling PNOV and rotating into PJUL (resets in two weeks on June 30) the investor could lock in profits and create fresh downside protection with a new upside cap (14.28%) over the next 12-month outcome period.
A more conservative strategy would have been to sell PNOV and park the proceeds in Treasury bills for the remainder of the outcome period.
PNOV to Cash, then Back to PNOV
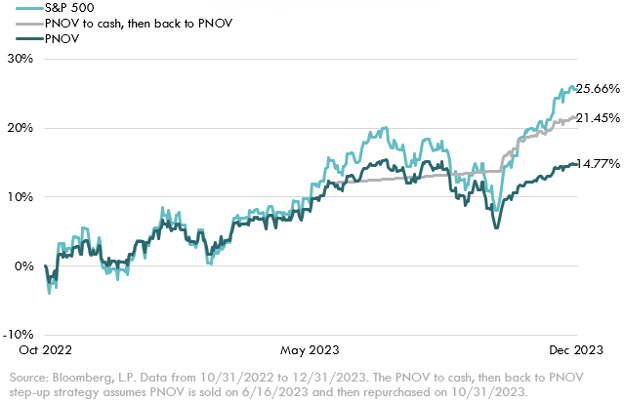
With the benefit of hindsight, a move from PNOV to cash on June 16, and then back to PNOV on October 31, 2023 (the next reset date), would have significantly improved the cumulative percentage gain from October 31, 2022 to December 31, 2023.
In the hypothetical example highlighted in the graph, the investor chose to sell PNOV on June 16 and wait to repurchase it on its next reset date on October 31. It proved to be a highly profitable trade. By repurchasing PNOV on October 31, the investor got a fresh protective buffer and new upside cap.
The graph shows a nice visual of how a move from PNOV to cash on June 16, and then back to PNOV on October 31, would have performed relative to the reference asset and compared to a passive PNOV buy-and-hold strategy, by the end of 2023.
If an investor had held PNOV from its prior reset date to the end of 2023, the cumulative return would have been 14.77%. If the investor had instead sold PNOV on June 16 and repurchased it on October 31, there would have been a significant increase in performance. The total cumulative return to the end of 2023 would have been 21.45%. Note, as is clearly shown in the graph, both Buffer ETF strategies lagged the performance of the S&P 500. The buy-and-hold approach of PNOV showed a cumulative return of 14.77%, and the active strategy (sell and repurchase PNOV on the next reset date) showed a return of 21.45%, but the S&P 500 returned 25.66%. Still, a buy-and-hold PNOV strategy would have performed nicely during the outcome period, and a protective sale of PNOV on June 16 and subsequent repurchase on October 31, would have been even more profitable. The S&P 500 will always at least slightly outperform Buffer ETFs in a rising market (fee drag), but an investment in the S&P 500 offers no downside protection whatsoever.
Obviously, in taxable accounts, an investor must consider the potential tax hit for realizing a short-term taxable gain compared to passively holding PNOV and potentially losing profits during the remainder of the outcome period. Intra-outcome active strategies are much easier to implement in tax-deferred accounts (no IRS reporting of capital gains).
Cumulative Returns: 10/31/2022 – 12/31/2023
PJAN to PSEP Step-Up Strategy
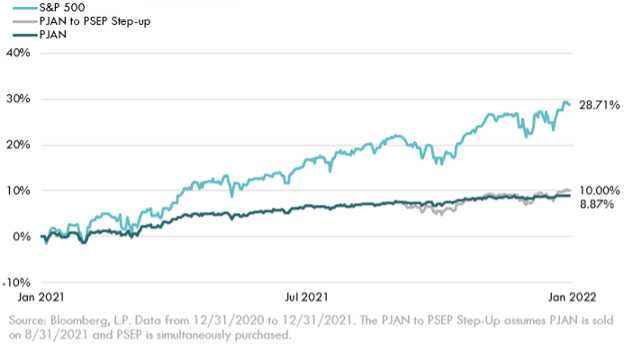
The hypothetical graph shows an example of how an investor could have utilized a step-up strategy in 2021. Let’s assume an investor purchased PJAN on the reset date on December 31, 2020. During the subsequent 12-month outcome period, the investor saw an opportunity to take profits on August 31, 2021 and simultaneously purchased PSEP. The investor locked in profits with the sale of PJAN and then bought PSEP on the reset date, thus creating a fresh 15% downside buffer and new upside cap. The improved performance through the end of the year was minimal, but the real advantage was locking in profits early (four months before the reset date) and receiving a new buffer and higher upside cap by simultaneously swapping into PSEP.
It’s important to stress again that during the intra-outcome period (before the next reset date) unrealized gains in Buffer ETF positions are unprotected. The initial investment at the start of the outcome period has protection in place (the amount of protection will vary depending on the Buffer series purchased), but any gains that show in Buffer ETFs prior to the next reset date are at risk. For example, a Buffer ETF could show a gain of 10% during the first eight months of the outcome period, but if the reference asset tumbles the last four months of the outcome period, the 10% unrealized profit could evaporate. So again, at times it can be prudent to capture gains before the end of the outcome period.
Bottom line, by paying attention to the ever-changing outcome parameters of Buffer ETFs, an investor will undoubtedly find some opportunities to lock in profits and potentially improve performance too.
Cumulative Returns: 12/31/2020 – 12/31/2021
Should you consider an intra-outcome sale in a rising market?
The decision to make an intra-outcome sale of a Buffer ETF in a rising market isn’t an easy one. Here are several factors to consider:
1. What are the current potential outcome parameters for the Buffer ETF you own?
2. What is your risk tolerance? Are you a conservative, moderate or aggressive investor?
3. Why did you buy your Buffer ETF? What were your investment objectives?
4. What are the tax consequences if you make an intra-outcome sale? Is the position held in a tax-deferred or taxable account?
5. What is your short-term opinion of the direction of the reference asset in the Buffer ETF you own? Do you fear a correction (drop of 10%), or a deeper decline?
It’s critical you answer these questions before making an intra-outcome sale of a Buffer ETF.
Let’s look at a hypothetical example using the price of Innovator’s U.S. Equity Power Buffer – November series (PNOV) on February 2, 2024. Let’s assume you bought PNOV on the last reset date (October 31, 2023), so your potential outcome parameters are the same as those shown in the table.
| Ticker | Asset -30% | Asset -20% | Asset -15% | Asset -10% | Asset -5% | Asset 0% | Asset 5% | Asset 10% | Asset 15% | Asset 20% | Asset 30% |
| PNOV | -10.62% | -8.46% | -8.14% | -2.74% | 2.67% | 5.97% | 5.97% | 5.97% | 5.97% | 5.97% | 5.97% |
The reference asset (SPY) has skyrocketed in a few short months. SPY is up 18.06% since the last reset date. PNOV has lagged SPY by a significant amount (-9.68%), but is still showing a healthy profit of 8.38% in the three months since the last reset date. Should you consider a sale of PNOV to lock in profits? The unrealized gains are not protected during the remainder of the outcome period (272 days), so if the reference asset declines and remains down by a significant amount when the next reset date comes around, you could lose your profits. So, what factors should be considered to decide if a sale of PNOV makes sense?
Let’s answer each of the questions posed at the start of this section to determine what could be the right course of action:
1. What are the current potential outcome parameters for the Buffer ETF you own?
The current potential outcome parameters make a sale of PNOV difficult. Sure, you have a nice unrealized profit of 8.38% in a very short period, but the fact that PNOV has lagged the return of SPY by 9.68%, makes a sale problematic. Why? Well, there are potential gains you could forgo by selling now. If SPY goes nowhere (“Asset Flat”), and even if SPY declines by no more than 5%, you’d still make more money in the position by the end of the outcome period. Look at the column titled “Asset -5%.” You can see that if SPY declines by 5%, you will still make another 2.67%. The prices of the option contracts within the Buffer ETF have caused the NAV of the ETF to lag SPY by a significant amount early in the outcome period (not atypical in a fast-rising market). However, PNOV should eventually “catch up” somewhat as the ETF nears the end of the outcome period (and perhaps sooner) due to time-value erosion as the options near expiration.
You should also consider that even if SPY is flat at the end of the outcome period, PNOV will still make another 5.97%. That’s not a bad return for a market that goes nowhere from its current level to the next reset date. Note, the upside for the ETF is capped at 5.97% from the current level of SPY. So, if SPY gains more, you will not participate in those gains – you’ll be capped out at 5.97% from the current level.
My opinion is the potential outcome parameters make it difficult to sell PNOV and lock in the 8.38% profit. SPY could be flat from its current level to the end of the outcome period, and you would still make nearly 6% more if you hold your position. And, if SPY declines 5% from the current level, you’ll still make another 2.67%.
2. What is your risk tolerance? Are you a conservative, moderate or aggressive investor?
If you have a very low tolerance for risk, you may be inclined to take your 8.38% profit. The column titled “Downside Before Buffer” indicates that if PNOV has a significant decline at the end of the outcome period, you could lose your profits. PNOV could lose 8.53% before the buffer provides protection. A conservative investor might not want to risk losing the unrealized gains in PNOV. The more risk averse you are, the more inclined you might be to take your profits.
3. Why did you buy PNOV? What were your investment objectives?
The reason for your purchase of PNOV could influence whether or not you make a sale of shares intra-outcome. Did you buy PNOV mainly for the 15% downside protection or were you more focused on the nearly 15% upside potential over the outcome period? At the outset, would you have been happy to capture a gain of 8.38% in just three months? 8.38% in three months is an annualized return of over 30%. So, if you are content with a three-month return of 8.38%, and you are more focused on not losing your unrealized gains than trying to capture the additional 5.97% maximum return, then you may decide to sell now.
4. What are the tax consequences if you make an intra-outcome sale? Is the position held in a tax-deferred or a taxable account?
If you hold PNOV in a taxable account and the position shows a short-term gain, you’ll likely want to hold it to avoid paying taxes (ordinary income tax on a short-term capital gain). If you hold to the next reset date and get to long-term tax status (more than one year), this could result in substantial tax savings, assuming you eventually sell at some point after reaching long-term capital gain status. Of course, by holding the position you know the unrealized gains are at risk until the next reset date, but you also know that you have a chance to make another 5.97% and avoid a short-term capital gain tax hit. I’d lean towards holding the position to at least get to long-term tax status. Obviously, if you hold PNOV in a tax-deferred account this topic is moot.
5. What is your opinion of the short-term direction of the reference asset (SPY)? Do you fear a correction (10% drawdown) or deeper decline?
Your opinion as to the direction of the reference asset in the coming months could influence your decision to hold or sell PNOV. If you fear a significant decline, for whatever reasons, you may be inclined to sell and lock in your profits now. Yes, you could owe taxes on your gain, but if you’re worried about a decline of 8.53% or more in PNOV (“Downside Before Buffer”), and it happens, then your profits will erode and perhaps turn into unrealized losses, and you’ll likely be disappointed you didn’t sell earlier. If, on the other hand, you expect SPY to be relatively stable (range-bound sideways action) or even move higher in the coming months, then you’ll likely want to hold your position and hopefully capture an additional 5.97% gain over the remainder of the outcome period.
There are many factors to consider in this hypothetical example of PNOV. You’ve had the good fortune to have made a very nice profit in a short period of time, but the fact that PNOV has lagged the reference asset (SPY) by a significant amount makes a decision to sell quite difficult.
| Ticker | Fund Price | Fund Return | Asset Return | Return Difference | Asset Return to Cap | Remaining Cap | Down Before Buffer | Remaining Days |
| PNOV | $34.97 | 8.38% | 18.06% | -9.68% | -1.94% | 5.97% | -8.53% | 272 |
Let’s look at another hypothetical example using the price of Innovator’s U.S. Equity Power Buffer – October series (POCT) on April 30, 2024. Let’s assume you bought POCT on the last reset date (September 30, 2023), so your outcome parameters are the same as those shown in the table.
Should you consider an intra-outcome sale of POCT?
The reference asset (SPY) is up 19.32% since the last reset date. POCT has lagged SPY by a significant amount (-8.82%), but is still showing a nice profit of 10.49% in the seven months since the last reset date. Should you consider a sale of POCT to lock in profits? As you know, the unrealized gains are unprotected during the remainder of the outcome period (154 days), so if the reference asset suffers a significant decline, you could lose your profits and some of your principal too. So, does a sale of POCT make sense?
A primary consideration in this hypothetical example is the percentage shown in the column titled “Downside Before Buffer.” The buffer doesn’t protect the unrealized gains you’ve had since your purchase on the last reset date. The ETF could decline 10.29% before the buffer would provide protection. And, during the remainder of the outcome period, if SPY declines by 20% or more, you’ll lose your profits (“Asset -20%”). Does the potential upside of 3.71% (“Remaining Cap”) over the remaining five months of the outcome period warrant taking the risk and potentially losing your profits?
If you hold POCT in a tax-deferred account (e.g., IRA) the gains will not be subject to capital gains tax. If that is the case, then I think a sale of POCT makes complete sense. Your upside potential over the next five months is only 3.71%, but you’re risking nearly 3x as much, given you could lose all your profits. Furthermore, if you take your profits and invest the proceeds of the sale of POCT in Treasury bills, you could earn approximately 2.25%, with no risk, over the remaining five months of the outcome period. So, if you decide to hold POCT to the next reset date, the net upside potential in POCT is only 1.46% more than what you could earn in Treasury bills (3.71% – 2.25% = 1.46%). Is it worth the risk of losing your 10% profit for an additional gain of only 1.46% beyond what Treasury bills will pay you over the next five months? I think not.
In this hypothetical example, the fact that three-month Treasury bills are currently paying approximately 5.4% annualized makes it an easy decision to sell POCT. It’s simply not worth holding POCT, and potentially losing your profits, to earn only 1.46% beyond what you could earn in Treasury bills over the remainder of the outcome period. Again, I think it’s an easy decision to sell if you own POCT in a tax-deferred account.
Another potentially attractive investment strategy is to sell POCT and rotate into PMAY, which resets the same day (April 30) you are considering the sale. Instead of buying Treasury bills, you could rotate (step up) into PMAY and get a fresh buffer at the current price level of the reference asset, with a new upside cap. The upside cap for PMAY is 14.30% (before fees), with 15% downside protection, so this could be a compelling investment over the 12-month outcome period.
Note, if you own POCT in a taxable account, then you have a much more difficult decision. If you’ve only held the position for seven months, and you sell, you could owe short-term capital gains taxes, which are typically taxed at a higher rate than long-term capital gains. So, this gives you incentive to hold the position for another five months. Of course, by holding POCT to get to the next reset date and long-term tax status, you risk losing your profits. Still, I’d lean towards holding POCT to get to long-term tax status, with fresh protection on the next reset date.
In summary, if you decide to sell your shares of POCT, you have two attractive investment options to consider: 1) purchase Treasury bills for the remainder of the outcome period, or 2) invest in PMAY with a new buffer and upside cap.
An intra-outcome sale of a Buffer ETF in a rising market is typically not an easy decision to make. Weigh your answers to the questions in this section carefully.
Should you consider an intra-outcome sale in a declining market?
Let’s look at some factors that should be considered before making an intra-outcome sale of a Buffer ETF in a declining market, also known as a “step down.” Let’s assume you purchased all three of the Innovator January series Buffer ETFs on the reset date, the last business day of 2021. The reference asset (SPY) has suffered a deep decline since your purchases and all three positions show unrealized losses. Should you sell your holdings and rotate into a different Buffer series? Here are some factors to consider:
1. What are the current potential outcome parameters for your Buffer ETFs?
2. How far has the reference asset (SPY) declined and how have the Buffer ETFs performed relative to the reference asset?
3. How much time remains in the outcome period of the Buffer ETFs?
4. What is your risk tolerance? Are you a conservative, moderate or aggressive investor?
5. Are the positions held in a taxable account? If so, is it advantageous to sell and harvest tax losses?
6. What is your short-term opinion of the direction of the reference asset (SPY)? Do you think it will decline further and finish even lower at the end of the outcome period? Or, will SPY recover somewhat by the end of the outcome period?
7. What are the starting upside caps for the three Buffer ETFs (BOCT, POCT, and UOCT) that are now resetting on September 30, 2022? Are the caps attractive enough to consider “stepping down” and rotating into the October series?
Let’s look at a hypothetical example using Innovator’s three Buffer ETFs – January series (BJAN, PJAN, and UJAN), on September 30, 2022. At the time, stocks were in a bear market and the S&P 500 had lost nearly 25% over the past 9 months. Again, we’re assuming you bought BJAN, PJAN, and UJAN on the last reset date, so your potential outcome parameters are the same as those shown in the table.
| Date | Ticker | Fund Price | Fund Return | SPY Level | SPY Return | Remaining Cap | Remaining Buffer | Downside Before Buffer | Remaining Outcome Period |
| 9/30/2022 | BJAN | $30.99 | -16.89% | 357.18 | -24.80% | 35.81% | -1.28% | 0.00% | 92 Days |
| 9/30/2022 | PJAN | $29.44 | -11.45% | 357.18 | -24.80% | 22.36% | -0.69% | 0.00% | 92 Days |
| 9/30/2022 | UJAN | $29.17 | -7.59% | 357.18 | -24.80% | 14.98% | 15.77% | 0.00% | 92 Days |
In the table you can see the potential outcome parameters for the three Buffer ETFs on September 30, 2022. As a refresher, BJAN provides protection against the first 9% loss from the prior reset date, PJAN offers 15% protection, and UJAN provides 30% protection, but not on the first 5% loss (-5% to -35%).
So far in 2022, the reference asset (SPY) has been crushed and is showing a loss of 24.80%. All the Buffer ETFs have held up much better than SPY, as they should during a bear market. UJAN has provided the most protection, showing an unrealized loss of only 7.59%. Nevertheless, all three positions have lost money since the last reset date (“Fund Return”). So, should you step down, realize the losses (tax-loss harvest), and rotate into a new Buffer series with additional downside protection, and a new upside cap? What factors should you consider before making a sale of any or all of the Buffer ETFs?
The additional information below should also be considered prior to making a sale:
Upside caps for the Innovator January 2022 Buffer ETF series:
BJAN: 13.5%
PJAN: 8.99%
UJAN: 6.89%
Upside caps for the Innovator October 2022 Buffer ETF series:
BOCT: 28.45%
POCT: 20.72%
UOCT: 17.08%
Let’s answer the following questions to determine what might be the right course of action:
1. What are the current potential outcome parameters for your Buffer ETFs?
The current outcome parameters make a sale of all the holdings in the January series potentially attractive. The Buffer ETFs have all outperformed the reference asset. For example, UJAN is only down 7.59% while SPY is off 24.80%. This could present an attractive risk-reward scenario from the current lower level of SPY. You could swap out of UJAN, take the tax loss, and purchase BOCT, which has an upside cap of 28.45%, which is considerably higher than the 6.89% upside cap on UJAN at the start of the outcome period (January 1, 2022). BOCT would also provide a 9% downside buffer from the current level while providing a starting upside cap that is much higher than the remaining upside cap of UJAN (14.98%).
A sale of PJAN, which shows a loss of 11.45% (less than half the loss of the reference asset), is also worth considering. Since PJAN has outperformed SPY by a considerable amount, you are in a good position to swap out of PJAN, harvest a tax loss, create a fresh buffer, and also increase the upside cap. You could swap into the 9% or 15% series. The 9% buffer, October series, offers an upside cap of 28.45%, and the 15% buffer offers an attractive 20.72% cap. Sure, you would be locking in a loss, but by not selling, you risk deeper losses because the ETFs are no longer “buffered” against losses – the reference asset has breached the buffer level. At this point, you don’t know if SPY is going to fall further or recover, but by rotating into a new Buffer series you could add more downside protection and still have the potential to recover nicely, with the high upside caps offered by the October series.
A sale of BJAN is perhaps more difficult. It provided minimal protection (9% before fees) against the losses of the reference asset, losing 16.89% while the reference asset declined 24.80%, and BJAN still shows an upside cap of 35.81%. So, if SPY recovers fast, you could recoup some losses. However, with only 92 days remaining in the outcome period, it is unlikely SPY will recoup a significant portion of its losses, and there is also the risk that SPY continues to decline and there is no remaining downside protection at this point. Thankfully, if you decide to step down and rotate out of BJAN and into BOCT, for example, the upside cap is still super attractive with BOCT at 28.45%. So, if SPY recovers over the next 12 months, you could recoup all of your losses and potentially show gains too.
Note, you also have the option to sell your three Buffer ETFs now, take the losses and then swap into SPY (or another index-based ETF), with no downside protection at all. With this strategy, you do not cap your upside return potential, assuming SPY recovers. This strategy could appeal to a more aggressive investor who could withstand additional losses if SPY continues to decline. A purchase of SPY obviously has no downside protection, but it offers unlimited upside potential.
A swap out of the three holdings and into one of the October series Buffer ETFs would likely make the most sense for conservative or moderate-risk investors. This move would provide some additional downside protection, but still allow the potential to recoup losses over the coming 12 months.
2. How far has the reference asset (SPY) declined and how have the Buffer ETFs performed relative to the reference asset?
As mentioned earlier, all three Buffer ETFs that you own have declined less than the reference asset. UJAN has performed the best, relatively speaking, losing 7.59%. PJAN is down 11.45% and BJAN is off 16.89%. The reference asset (SPY) has tumbled 24.8%. So, all three Buffer positions have held up relatively well and you should consider a sale/swap into the October Buffer series that offers a better chance to recoup your losses over a longer time horizon. Thankfully, all the Buffer ETFs in the October series offer compelling upside caps.
It’s also worth noting that if you’re thinking of rotating into a different Buffer series, be mindful of where the reference asset is trading relative to the buffer level. For example, if the reference asset is only slightly below your downside buffer level, all it needs to do is recover into the buffer zone at the end of the outcome period and your ETF will recoup all of its losses. However, if the reference asset is trading significantly below the buffer level, as is the case currently for BJAN, it would have to recover quickly to finish the outcome period inside the buffer for you to recoup your losses. SPY would have to surge over 20% in three months for BJAN to get back in its buffer zone by the end of the outcome period.
It’s important to be aware of the performance difference of the reference asset and your Buffer ETF, and know what percentage the reference asset would need to recover for your ETF to finish the outcome period inside the buffer zone. This information could influence your decision to rotate out, or not.
3. How much time remains in the outcome period?
You only have 92 days remaining in the outcome period for the January series you own, so it doesn’t give you much time to recoup your losses. You need the reference asset to rally quickly to get back into the buffer zones of your current holdings. For your Buffer ETFs that are trading well below the buffers, BJAN, for example, you may decide it’s unlikely it’ll recover enough in three months to get into the buffer zone, which would make stepping down and rotating into the October series perhaps an easier decision, at least for BJAN. Note, UJAN is still trading inside its buffer and still offers more downside protection, so you could decide to hold it. But again, UJAN has also significantly outperformed the reference asset, so it provides you with the best potential to outperform (assuming SPY recovers), if you rotate now to a new Buffer ETF series with a higher cap.
4. What is your risk tolerance? Are you a conservative, moderate, or aggressive investor?
If you have a very low tolerance for risk, you are likely not comfortable with the losses you’re seeing in two of your three Buffer ETF holdings. BJAN and PJAN have both lost quite a bit on a percentage basis, but have still nicely outperformed the reference asset. UJAN is showing a much smaller loss and still offers more downside protection (-5% to -35%), so this position is probably not a big concern for you. If you are a conservative investor, you will likely want to rotate out of BJAN and PJAN to get some additional downside protection from current levels, just in case SPY declines even further before the next reset date.
If you are a moderate or aggressive investor, you may want to capture the outperformance you’ve had and rotate into the new October series that offers higher caps and more time to recover your losses (12 months). If you are somewhat aggressive, you could swap into BOCT, which offers the least amount of additional downside protection, but also the highest cap. Or, you could swap into SPY, with no protection at all, but unlimited upside potential. If you are a moderate-risk investor, you may decide to rotate into POCT since it offers 15% downside protection, but still plenty of upside potential over the next 12 months.
5. Are your positions held in a taxable account? If so, is it advantageous to sell and harvest tax losses?
I think it’s usually a good idea to harvest tax losses whenever you can, so you may want to rotate out of all your Buffer ETFs (January series) that are currently showing losses. A tax-loss carryforward can be valuable and can help offset realized gains indefinitely (can be “carried forward” to future tax years). Still, I wouldn’t let your tax situation alone influence your decision since there are so many other factors to consider.
Note, if you realized taxable gains earlier in the year, and you want to help offset those gains, then you will likely want to harvest your tax losses and rotate into a different Buffer series. Note, in tax-deferred accounts, where there is no reporting of gains or losses to the IRS, this topic is moot.
6. What is your short-term opinion of the direction of the reference asset (SPY)? Do you fear SPY could decline further or do you anticipate a recovery?
Your opinion as to the direction of the reference asset in the coming months could influence your decision to hold or rotate out of the January series. If you fear a further decline in the reference asset, for whatever reasons, you may be inclined to sell now and rotate into a new Buffer series that offers additional downside protection. UJAN still provides more downside protection, but your other two holdings don’t offer any more protection. So, if you think SPY may continue to decline in the remaining few months of the outcome period, you might want a fresh buffer and a swap could make sense.
On the other hand, if you think the selling has exhausted itself and the reference asset is poised to recover quickly, you would likely want to at least sell your two positions that offer the most protection (PJAN and UJAN), and rotate into the October series that offers minimal protection, but has the highest upside cap. Sure, you need to have the necessary risk tolerance to make this move, but it would allow for the most upside potential if you’re correct with your market call. Furthermore, it would provide you with some additional downside protection.
7. What are the starting upside caps for the three Buffer ETFs (BOCT, POCT, and UOCT) that are now resetting on September 30, 2022?
The upside caps for the October series are very attractive. They offer some of the highest caps since Buffer ETFs were first launched in 2018. So, all three of the October Buffer ETFs are worth considering. POCT might be the sweet spot if you are a moderate-risk investor. It offers 15% downside protection, in case the reference asset continues to decline, but it also offers a very attractive upside cap (20.72%) that would allow you to recoup losses if SPY rebounds strongly over the outcome period. The high upside caps of the October series could influence you to rotate out of the January series and into the October series.
Please recognize that options market pricing is hyper-efficient, intra-outcome period. So, despite the higher caps for the October series, staying put in the January series wouldn’t necessarily be a “bad move.” You don’t have to rotate or step down in a declining market, but if you are looking to possibly capitalize on a potential opportunity, and it fits your specific outlook and time horizon, then an intra-outcome trade could indeed be attractive.
There are many factors to consider when deciding if it makes sense to step down and rotate into a new Buffer series in a declining market. Weigh your answers to the questions in this chapter carefully to decide which course of action would make the most sense for you.
It can be helpful to study the historical performance of Buffer ETFs during both volatile bear markets and positive-trending bull markets. If you have an understanding of the price action of Buffer ETFs, it can help you manage your expectations during both good and bad markets.
In 2022, unprecedented market dynamics created challenges for all investors. We saw a rapid tightening of U.S. monetary policy, inflation, and significant market volatility. Both stocks and bonds had negative double-digit returns, leading to one of the worst years in history for a traditional 60/40 stock-bond portfolio allocation. And, the traditional risk-off move to bonds didn’t help in 2022.
Buffer ETFs performed as expected in 2022 and helped protect portfolios from deep losses. As a result, Buffer ETFs saw unprecedented growth, making them one of the fastest growing corners of the ETF marketplace.
Let’s look at a case study of the 2022 bear market and how Buffer ETFs (January series) from both Innovator and Allianz performed. Did they perform as expected? Indeed, they did.
The Previous Outcome Period Tool on Innovator’s website allows investors to look at the past performance of all Innovator Buffer ETFs, during a previous outcome period, to see how they performed relative to the reference asset. Let’s dissect the 2022 performance of Innovator’s January Buffer ETF series, 9%, 15%, and 30% (-5% to -35%), relative to their reference asset (SPY).
Innovator U.S. Equity Buffer – January (BJAN)
You can see in the graph and table that during the outcome period, BJAN mostly tracked its reference asset lower, but with 23% less volatility (0.77 beta). At the start of the outcome period, BJAN provided a buffer against the first 9% loss (before fees).
BJAN returned -11.21% during the outcome period while SPY returned -19.48%. BJAN showed a maximum drawdown of -17.26% compared to -25.36% for SPY.
Summary: BJAN provided a buffer against losses of approximately 8.27% (net of fees), as expected, and shareholders outperformed SPY during the outcome period.
BJAN vs. SPY (2022)

| 1/1/2022 - 12/31/2022 | BJAN | SPY |
| Return | -11.21% | -19.48% |
| Beta | 0.77 | 1.00 |
| Return/Risk | – | – |
| Max Drawdown | -17.26% | -25.36% |
| Starting Price/Level | $37.28 | 474.96 |
| Ending Price/Level | $33.11 | 382.43 |
Innovator U.S. Equity Power Buffer – January (PJAN)
The graph and table show PJAN tracked its reference asset lower in 2022, but with much less volatility (0.57 beta). The result was a more comfortable investment experience for shareholders compared to holding SPY without any downside protection. At the start of the outcome period, PJAN provided a buffer against the first 15% loss (before fees).
PJAN returned -5.22% during the outcome period while SPY returned -19.48%. PJAN showed a maximum drawdown of -11.88% compared to -25.36% for SPY.
Summary: PJAN provided a buffer against losses of approximately 14.26% (net of fees), as expected, and shareholders considerably outperformed SPY during the outcome period, as they should during a bear market.
PJAN vs. SPY (2022)

| 1/1/2022 – 12 /31/2022 | PJAN | SPY |
| Return | -5.22% | -19.48% |
| Volatility | 14.04% | 24.22% |
| Beta | 0.57 | 1.00 |
| Return/Risk | – | – |
| Max Drawdown | -11.88% | -25.36% |
| Starting Price/Level | $33.25 | 474.96 |
| Ending Price/Level | $31.52 | 382.43 |
UJAN vs. SPY (2022)

| 1/1/2022 – 12 /31/2022 | UJAN | SPY |
| Return | -5.73% | -19.48% |
| Volatility | 7.44% | 24.22% |
| Beta | 0.25 | 1.00 |
| Return/Risk | – | – |
| Max Drawdown | -8.82% | -25.36% |
| Starting Price/Level | $31.56 | 474.96 |
| Ending Price/Level | $29.75 | 382.43 |
Innovator U.S. Equity Ultra Buffer – January (UJAN)
The graph and table show UJAN tracked the reference asset lower in 2022, but with significantly less volatility (0.25 beta). Its return mostly hugged the -5% level for most of the outcome period. The result was a much better investment experience for shareholders compared to holding SPY without any downside protection. At the start of the outcome period, UJAN provided a buffer against a 30% loss, but shareholders were not protected from the first 5% loss. The buffer protects from -5% to -35%. Note, the 2022 bear market was not deep enough to have breached the buffer level, so shareholders were fully protected below -5% throughout the outcome period.
UJAN returned -5.73% during the outcome period while SPY returned -19.48%. UJAN showed a maximum drawdown of -8.82% compared to -25.36% for SPY.
Summary: UJAN provided a deep buffer against losses of approximately 13.75% (net of fees), as expected, and shareholders considerably outperformed SPY during the outcome period.
It’s interesting to compare the performance of PJAN and UJAN during a relatively shallow bear market like 2022. PJAN, which provided 15% downside protection, slightly outperformed UJAN (-5.22% vs. -5.73%), which provided 30% protection, but not on the first 5% loss. The reason for the slight outperformance by PJAN, was the reference asset finished the period down only 19.48%, which is not that much lower than the 15% buffer provided by PJAN. Obviously, if SPY had finished the outcome period down another 10% or so, UJAN would have greatly outperformed PJAN.
With the benefit of hindsight, an investor would have been slightly better off with less protection in PJAN in 2022, than in UJAN, which offered double the amount of protection, but without protection on the first 5% loss. This is somewhat surprising.
Unfortunately, it’s not only impossible to predict a bear market, but it’s also impossible to predict the depth of the decline. Investors would be wise to choose their level of downside protection based on their risk tolerance and other pertinent factors, but not on their ability to predict a bear market.
Two Buffer ETFs from Allianz also provide proof of how shareholders outperformed during the 2022 bear market.
Allianz U.S. Large Cap Buffer 10 – January (JANT)
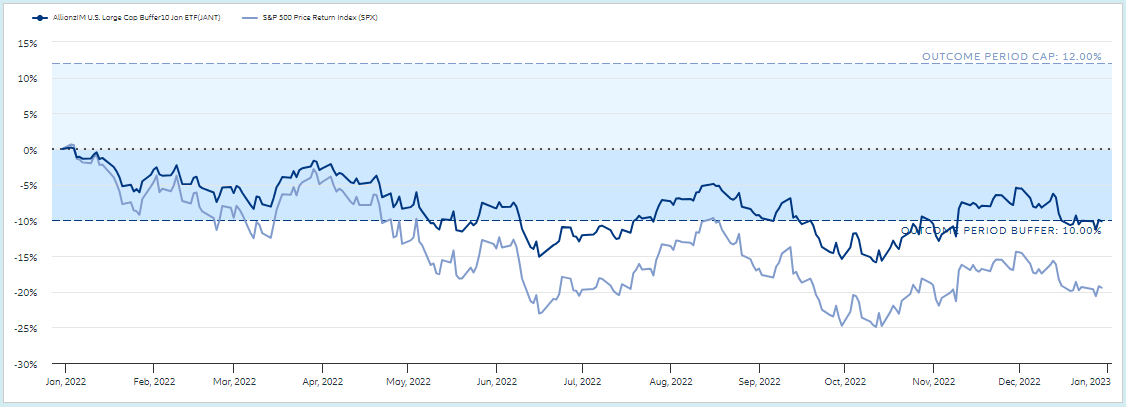
The graph and table show the performance of Allianz U.S. Large Cap Buffer 10 – January (JANT) vs. its reference asset, SPX (S&P 500).
During the outcome period, JANT mostly tracked its reference asset lower, but with 30% less volatility (0.70 beta). At the start of the outcome period, JANT provided a buffer against the first 10% loss (before fees), with an upside cap of 12%.
JANT returned -10.13% during the outcome period while SPX returned -19.44%. JANT showed a maximum drawdown of -16.07% compared to -25.43% for SPX.
Summary: JANT provided a buffer against losses of approximately 9.31% (net of fees), as expected, and shareholders outperformed SPX during the outcome period.
JANT vs. SPX (2022)
| 1/1/2022 - 12/31/2022 | JANT | SPX |
| Return | -10.13% | -19.44% |
| Volatility | 17.27% | 24.13% |
| Beta | 0.70 | 1.00 |
| Return/Risk | – | – |
| Max Drawdown | -16.07% | -25.43% |
| Starting Price/Level | $28.19 | 4766.18 |
| Ending Price/Level | $25.34 | 3739.50 |
Allianz U.S. Large Cap Buffer 20 – January (JANW)
The graph and table show the performance of Allianz U.S. Large Cap Buffer 20 – January (JANW) vs. its reference asset, SPX (S&P 500), during the 2022 bear market.
JANW tracked its reference asset only slightly lower during much of the outcome period, and with much less volatility (0.38 beta). At the start of the outcome period, JANW provided a buffer against the first 20% loss (before fees).
At the end of the outcome period, JANW returned -0.65% while SPX returned -19.44%. JANW had a maximum drawdown of -8.69% in 2022 compared to -25.43% for SPX.
Summary: JANW provided a buffer against losses of approximately 18.79% (net of fees), as expected, and shareholders greatly outperformed SPX during the outcome period, as they should during a bear market.
| 1/1/2022 - 12/31/2022 | JANW | SPX |
| Return | -0.65% | -19.44% |
| Volatility | 9.58% | 24.13% |
| Beta | 0.38 | 1.00 |
| Return/Risk | – | – |
| Max Drawdown | -8.69% | -25.43% |
| Starting Price/Level | $26.55 | 4766.18 |
| Ending Price/Level | $26.38 | 3839.50 |
It’s helpful to compare the performance of a relatively deep buffer, like Allianz’s Buffer 20 ETF, to major indices in 2022. Sure, 2022 was somewhat unique since nearly all asset classes were highly correlated and declined at the same time, but the benefits of a 20% buffer in a difficult year like 2022 cannot be overstated.
2022 JANW Drawdown & Return Comparison vs. Major Indices
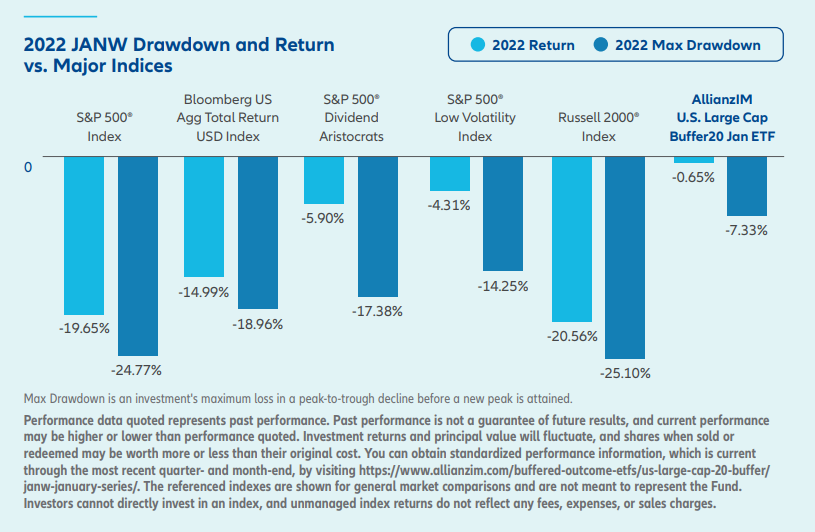
Allianz’s Buffer 20 ETF had a single-digit maximum drawdown in 2022 while the S&P 500 had a maximum drawdown of -24.77%. The Russell 2000 also suffered a maximum drawdown of -25.10%. Bloomberg’s Aggregate Bond Index had a surprisingly large maximum drawdown of nearly -19%. In addition, equities that are supposed to hold up well in bad markets, like S&P 500 Low Volatility, and S&P 500 Dividend Aristocrats, didn’t provide much comfort for investors.
From a performance perspective, JANW was stellar simply because it didn’t lose money (before fees). Its 2022 performance, thanks to its 20% buffer, was -0.65%. JANW outperformed the price return of the S&P 500 by nearly 19%. And, JANW handily beat all the other benchmarks shown in the chart. Bottom line, in a year as challenging as 2022 was for nearly all asset classes, Buffer ETFs like JANW, with moderate to deep protection, provided great value.
Return is based on NAV. Volatility is a statistical measure of the dispersion of returns for a particular asset or index. Beta is a measure of the volatility of an individual stock in comparison to the unsystematic risk of the entire market. Return/Risk is the relationship between the amount of return gained on an investment and the amount of risk undertaken in that investment. Max drawdown is the maximum observed loss from a peak to a trough of a portfolio, before a new peak is attained.
Performance quoted represents past performance, which is no guarantee of future results. Investment returns and principal value will fluctuate, so you may have a gain or loss when shares are sold. Current performance may be higher or lower than that quoted. Returns less than one year are cumulative. One cannot invest directly in an index.
Current figures are net of accrued outcome period expenses to date. Net figures include outcome period expenses yet to be incurred.
Fund return and current outcome period values assume reinvestment of capital gain distributions, if any. Investors purchasing the fund intra-period will achieve a different defined outcome than those who entered on day one. The remaining cap represents the maximum return the fund can achieve at its current price. The index may need to rise higher or lower than the remaining cap before the remaining cap is realized. If the remaining buffer is greater than the fund’s starting buffer, a portion of the buffer will be realized before the downside before buffer begins. After the downside before buffer has been realized, the final portion of the buffer will begin again.
Let’s look at a case study of the 2023 bull market and how Buffer ETFs from Innovator and Allianz (January series) performed. Did they perform in line with the defined outcome parameters indicated at the start of the outcome period? Absolutely.
Let’s review the 2023 performance of Innovator’s January series Buffer ETFs, 9%, 15%, and 30% (-5% to -35%), relative to their reference asset (SPY).
Innovator U.S. Equity Buffer – January (BJAN)
You can see in the graph and table that during the outcome period, BJAN tracked its reference asset higher, but with less volatility (0.80 beta). At the start of the outcome period, BJAN provided a buffer against the first 9% loss (before fees), but with the benefit of hindsight, the buffer wasn’t needed in 2023. The upside cap at the start of the outcome period was indicated at 25.06%.
BJAN provided a return of 23.48% during the outcome period while SPY returned 24.28%. BJAN had a maximum drawdown of -8.22% compared to -10.29% for SPY.
Summary: BJAN tracked the performance of the reference asset closely during the outcome period, and only slightly lagged the return of the reference asset (SPY) while also providing some downside protection.
BJAN vs. SPY (2023)

| 1/1/2023 – 12 /31/2023 | BJAN | SPY |
| Return | 23.48% | 24.28% |
| Volatility | 10.67% | 13.16% |
| Beta | 0.80 | 1.00 |
| Return/Risk | 2.20 | 1.85 |
| Max Drawdown | -8.22% | -10.29% |
| Starting Price/Level | $33.11 | 382.44 |
| Ending Price/Level | $40.88 | 475.31 |
Innovator U.S. Equity Power Buffer – January (PJAN)
The graph and table show PJAN mostly tracked its reference asset higher in 2023, but with less volatility (0.54 beta). The result was a comfortable investment experience for shareholders, but with some underperformance, which is to be expected with a moderate buffer in a very strong market. At the start of the outcome period, PJAN provided a buffer against the first 15% loss (before fees). The upside cap at the start of the outcome period was indicated at 18.84%.
PJAN provided a return of 18.05% during the outcome period while SPY returned 24.28%. PJAN had a maximum drawdown of -5.75% compared to -10.29% for SPY.
Summary: PJAN mostly tracked the performance of its reference asset during the outcome period, but lagged the return of the reference asset (SPY) by 6.24%.
PJAN vs. SPY (2023)

| 1/1/2023 – 12 /31/2023 | PJAN | SPY |
| Return | 18.05% | 24.28% |
| Volatility | 7.62% | 13.16% |
| Beta | 0.54 | 1.00 |
| Return/Risk | 2.37 | 1.85 |
| Max Drawdown | -5.75% | -10.29% |
| Starting Price/Level | $31.52 | 382.43 |
| Ending Price/Level | $37.21 | 475.31 |
Innovator U.S. Equity Ultra Buffer – January (UJAN)
The graph and table show UJAN somewhat tracked its reference asset higher in 2023, but with much less volatility (0.46 beta). The result was a positive investment experience for shareholders, but with some meaningful underperformance. At the start of the outcome period, UJAN provided a buffer against a 30% loss (-5% to -35%), but obviously the buffer was not needed in 2023. The upside cap at the start of the outcome period was indicated at 16.40%.
UJAN provided a return of 15.60% during the outcome period while SPY returned 24.28%. UJAN had a maximum drawdown of -4.87% compared to -10.29% for SPY.
Summary: UJAN somewhat tracked the performance of the reference asset during the outcome period, but lagged the return of the reference asset (SPY) by 8.69%.
UJAN vs. SPY (2023)

The performance of two Buffer ETFs from Allianz shows how their Buffer ETFs (January series) performed during the 2023 bull market, after providing much-needed protection during the 2022 bear market.
Allianz U.S. Large Cap Buffer 10 – January (JANT)
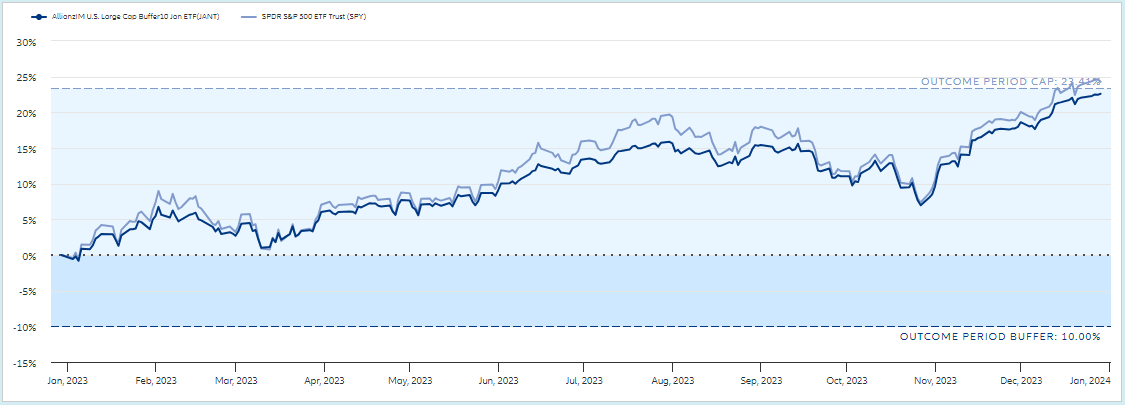
The graph and table show the performance of Allianz U.S. Large Cap Buffer 10 – January series (JANT) vs. its reference asset (SPY).
JANT mostly tracked its reference asset higher in 2023, but with less volatility (0.73 beta). The result was a worry-free investment experience for shareholders, but with slight underperformance. At the start of the outcome period, JANT provided a buffer against the first 10% loss (before fees). The upside cap at the start of the outcome period was indicated at 23.41%.
JANT provided a return of 22.61% during the outcome period while SPY returned 24.28%. JANT had a maximum drawdown of -7.70% compared to -10.29% for SPY.
Summary: JANT closely tracked SPY during the outcome period, but slightly lagged the return of the reference asset (SPY) by 1.68%.
JANT vs. SPY (2023)
| 1/1/2023 - 12/31/2023 | JANT | SPY |
| Return | 22.61% | 24.28% |
| Volatility | 9.83% | 13.16% |
| Beta | 0.73 | 1.00 |
| Return/Risk | 2.30 | 1.85 |
| Max Drawdown | -7.70% | -10.29% |
| Starting Price/Level | $25.34 | 382.43 |
| Ending Price/Level | $31.06 | 475.31 |
Allianz U.S. Large Cap Buffer 20 – January (JANW)
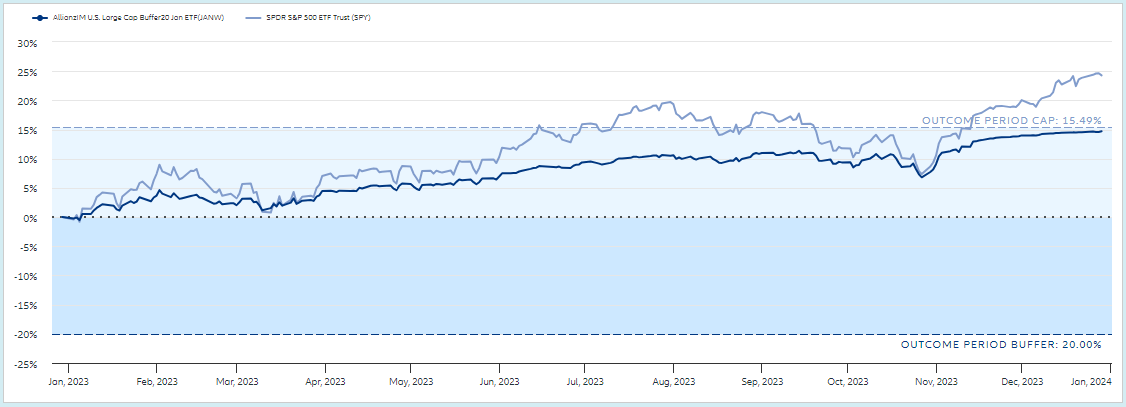
The graph and table show the performance of Allianz U.S. Large Cap Buffer 20 – January series (JANW) vs. its reference asset (SPY).
JANW somewhat tracked its reference asset higher in 2023, but with much less volatility (0.42 beta). The result was a smooth ride for shareholders, but with some underperformance, which is to be expected with a relatively deep buffer in a strong market. At the start of the outcome period, JANW provided a buffer against the first 20% loss (before fees). The upside cap at the start of the outcome period was 15.49%.
JANW provided a return of 14.69% during the outcome period while SPY returned 24.28%. JANW had a maximum drawdown of -4.08% compared to -10.29% for SPY.
Summary: JANW somewhat tracked the reference asset during the outcome period, but lagged the return of the reference asset (SPY) by 9.59%.
JANW vs. SPY (2023)
| 1/1/2023 - 12/31/2023 | JANW | SPY |
| Return | 14.69% | 24.28% |
| Volatility | 5.99% | 13.16% |
| Beta | 0.42 | 1.00 |
| Return/Risk | 2.45 | 1.85 |
| Max Drawdown | -4.08% | -10.29% |
| Starting Price/Level | $26.38 | 382.44 |
| Ending Price/Level | $30.26 | 475.31 |
With the benefit of hindsight, an investor would have obviously wanted the least amount of protection in 2023, which would have allowed for the highest upside cap. BJAN or JANT would have been ideal choices in 2023 since they both provided nearly full participation in the gains of the reference asset.
What’s critical to note is the Buffer ETFs all performed as expected given the defined outcome parameters provided by the issuing companies at the start of the outcome period.
Return is based on NAV. Volatility is a statistical measure of the dispersion of returns for a particular asset or index. Beta is a measure of the volatility of an individual stock in comparison to the unsystematic risk of the entire market. Return/Risk is the relationship between the amount of return gained on an investment and the amount of risk undertaken in that investment. Max drawdown is the maximum observed loss from a peak to a trough of a portfolio, before a new peak is attained.
Performance quoted represents past performance, which is no guarantee of future results. Investment returns and principal value will fluctuate, so you may have a gain or loss when shares are sold. Current performance may be higher or lower than that quoted. Returns less than one year are cumulative. One cannot invest directly in an index.
Current figures are net of accrued outcome period expenses to date. Net figures include outcome period expenses yet to be incurred.
Fund return and current outcome period values assume reinvestment of capital gain distributions, if any. Investors purchasing the fund intra-period will achieve a different defined outcome than those who entered on day one. The remaining cap represents the maximum return the fund can achieve at its current price. The index may need to rise higher or lower than the remaining cap before the remaining cap is realized. If the remaining buffer is greater than the fund’s starting buffer, a portion of the buffer will be realized before the downside before buffer begins. After the downside before buffer has been realized, the final portion of the buffer will begin again.
The bear-to-bull market of 2022-2023 provides an excellent case study that highlights how Buffer ETFs can preserve wealth in a declining market, and also participate nicely during a rebound at the start of a new bull market.
In this section we’ll see how Buffer ETFs (January series) from Innovator and Allianz performed over the two-year, bear-to-bull market period, relative to the SPDR S&P 500 ETF Trust (SPY). The returns of all five Buffer ETFs studied during the period prove the value of having a buffer in a difficult year like 2022, and perhaps surprisingly, how they have the potential to outperform in a volatile bear-to-bull market.
Innovator U.S. Equity Buffer – January (BJAN)
You can see in the graph and table that during the two-year period, BJAN mostly tracked its reference asset, but with slightly less volatility. At the start of each outcome period, BJAN provided a buffer against the first 9% loss (before fees).
BJAN had a total return of 9.65% during the two-year period while SPY returned 3.26%, including dividends. BJAN showed a maximum drawdown of -17.26% compared to a maximum drawdown of -24.50% for SPY.
Summary: BJAN provided a minimal buffer against losses during the 2022 bear market, but it was enough protection to help BJAN outperform the reference asset (SPY) by 6.39% over the two-year period.
BJAN vs. SPY (2022 – 2023)

| 1/1/2022 – 12 /31/2023 | BJAN | SPY |
| Return | 9.65% | 3.26% |
| Volatility | 15.31% | 19.45% |
| Beta | 0.78 | 1.00 |
| Return/Risk | 0.31 | 0.09 |
| Max Drawdown | -17.26% | -24.50% |
| Starting Price/Level | $37.28 | 474.96 |
| Ending Price/Level | $40.88 | 475.31 |
Innovator U.S. Equity Power Buffer – January (PJAN)
The graph and table show PJAN mostly tracked its reference asset during the two-year period, but with quite a bit less volatility (0.56 beta). The result was an easier ride for shareholders compared to holding SPY without any downside protection. At the start of each outcome period, PJAN provided a buffer against the first 15% loss (before fees).
PJAN had a total return of 11.89% during the two-year period while SPY returned 3.26%, including dividends. PJAN showed a maximum drawdown of -11.88% compared to -24.50% for SPY.
Summary: PJAN provided an important buffer against losses during the 2022 bear market and handily outperformed the reference asset (SPY) by 8.63% over the two-year period
PJAN vs. SPY (2022 – 2023)

| 1/1/2022 – 12 /31/2023 | PJAN | SPY |
| Return | 11.89% | 3.26% |
| Volatility | 11.35% | 19.45% |
| Beta | 0.56 | 1.00 |
| Return/Risk | 0.51 | 0.08 |
| Max Drawdown | -11.88% | -24.50% |
| Starting Price/Level | $33.25 | 474.96 |
| Ending Price/Level | $37.21 | 475.31 |
Innovator U.S. Equity Ultra Buffer – January (UJAN)
The graph and table show UJAN somewhat tracked its reference asset, but with significantly less volatility (0.30 beta). Its return mostly hugged the -5% level during the 2022 bear market, and then it participated in the upside during the bull market in 2023. At the start of each outcome period, UJAN provided a buffer against a 30% loss (before fees), but shareholders were not protected from the first 5% loss. The buffer protects from -5% to -35%.
During the two-year, bear-to-bull market period, UJAN had a total return of 8.98% while SPY returned 3.26%, including dividends. UJAN showed a maximum drawdown of -8.82% compared to -24.50% for SPY.
Summary: UJAN provided a deep buffer against losses during the 2022 bear market and outperformed the reference asset (SPY) by 5.72% over the two-year period.
UJAN vs. SPY (2022 – 2023)

| 1/1/2022 – 12 /31/2023 | UJAN | SPY |
| Return | 8.98% | 3.26% |
| Volatility | 7.05% | 19.45% |
| Beta | 0.30 | 1.00 |
| Return/Risk | 0.62 | 0.08 |
| Max Drawdown | -8.82% | -24.50% |
| Starting Price/Level | $31.56 | 474.96 |
| Ending Price/Level | $34.40 | 475.31 |
It’s worth noting that all three Innovator January Buffer ETF series, with their various levels of downside protection and upside caps, were able to outperform SPY during the two-year, bear-to-bull market period. The data provide evidence of the value of “losing less” during a bear market (2022), thanks to the downside protection provided by Buffer ETFs, and how shareholders can also participate during a market rebound (2023).
BJAN, PJAN, UJAN (2022 – 2023)

Return is based on NAV. Volatility is a statistical measure of the dispersion of returns for a particular asset or index. Beta is a measure of the volatility of an individual stock in comparison to the unsystematic risk of the entire market. Return/Risk is the relationship between the amount of return gained on an investment and the amount of risk undertaken in that investment. Max drawdown is the maximum observed loss from a peak to a trough of a portfolio, before a new peak is attained.
Performance quoted represents past performance, which is no guarantee of future results. Investment returns and principal value will fluctuate, so you may have a gain or loss when shares are sold. Current performance may be higher or lower than that quoted. Returns less than one year are cumulative. One cannot invest directly in an index.
Current figures are net of accrued Outcome Period expenses to date. Net figures include Outcome Period expenses yet to be incurred.
Fund return and current outcome period values assume reinvestment of capital gain distributions, if any. Investors purchasing the fund intra-period will achieve a different defined outcome than those who entered on day one. The remaining cap represents the maximum return the fund can achieve at its current price. The index may need to rise higher or lower than the remaining cap before the remaining cap is realized. If the remaining buffer is greater than the fund’s starting buffer, a portion of the buffer will be realized before the downside before buffer begins. After the downside before buffer has been realized, the final portion of the buffer will begin again.
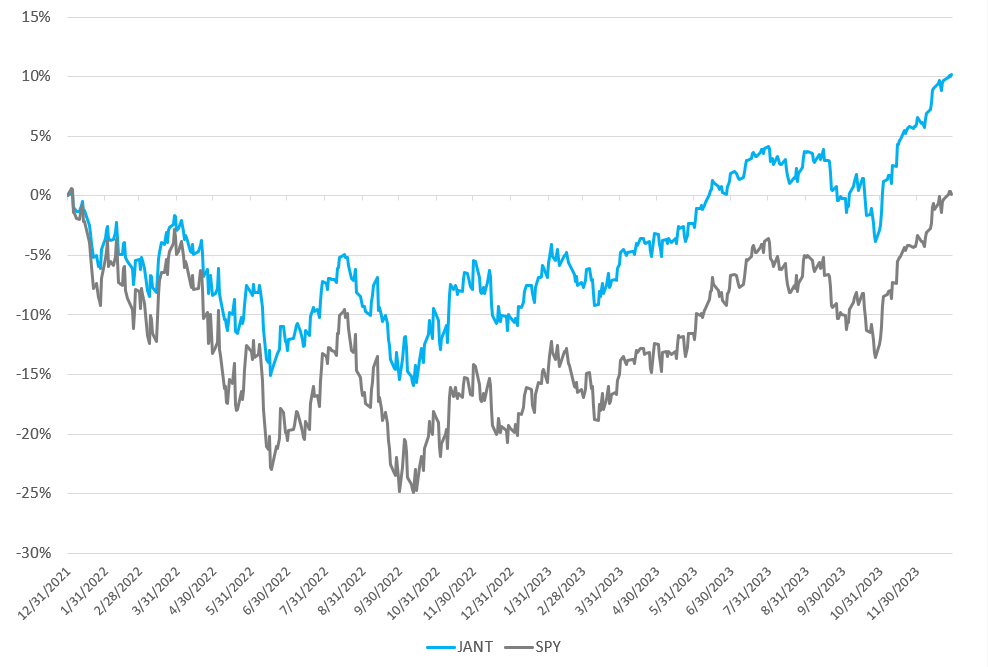
Allianz U.S. Large Cap Buffer 10 – January (JANT)
You can see in the graph and table that during the two-year period, JANT mostly tracked its reference asset, but with 30% less volatility. At the start of each outcome period, JANT provided a buffer against the first 10% loss (before fees).
JANT had a total return of 10.18% during the two-year period while SPY returned 3.26%, including dividends. JANT showed a maximum drawdown of -16.07% compared to -24.50% for SPY.
Summary: JANT provided a minimal buffer against losses during the 2022 bear market, but it was enough protection to help JANT outperform the reference asset (SPY) by 6.92% over the two-year period. Note, the graph shows the price returns for SPY, but data in the table include dividends.
JANT vs. SPY (2022-2023)
| 1/1/2022 - 12/31/2023 | JANT | SPY |
| Return | 10.18% | 3.26% |
| Volatility | 14.07% | 19.45% |
| Beta | 0.70 | 1.00 |
| Return/Risk | 0.72 | 0.08 |
| Max Drawdown | -16.07% | -24.50% |
| Starting Price/Level | $28.19 | 474.96 |
| Ending Price/Level | $31.06 | 475.31 |
Allianz U.S. Large Cap Buffer 20 – January (JANW)
The graph and table show JANW mostly tracked its reference asset during the two-year period, but with much less volatility (0.38 beta). The result was a very comfortable investment experience for shareholders compared to holding SPY without any downside protection. At the start of each outcome period, JANW provided a buffer against the first 20% loss (before fees).
JANW had a total return of 13.97% during the two-year period while SPY returned 3.26%, including dividends. JANW showed a maximum drawdown of -8.69% compared to -24.50% for SPY.
Summary: JANW provided an important buffer against all losses during the 2022 bear market and handily outperformed the reference asset (SPY) by 10.71% over the two-year period. Note, the graph shows the price returns for SPY, but data in the table include dividends.
JANW vs. SPY (2022-2023)
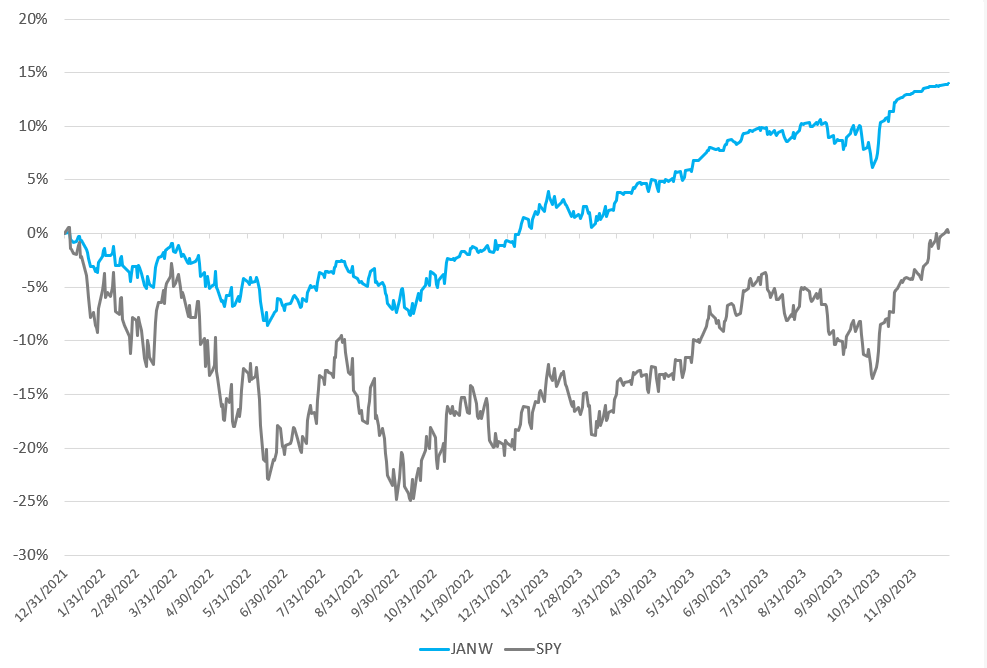
It’s worth highlighting that during the 2022-2023 bear-to-bull market, JANW was the best performer of the five Buffer ETFs reviewed in this case study. And, all the Buffer ETFs that were analyzed, with their various levels of downside protection and upside caps, outperformed SPY over the two-year period.
| 1/1/2022 - 12/31/2023 | JANW | SPY |
| Return | 13.97% | 3.26% |
| Volatility | 7.99% | 19.45% |
| Beta | 0.38 | 1.00 |
| Return/Risk | 1.75 | 0.08 |
| Max Drawdown | -8.69% | -24.50% |
| Starting Price/Level | $26.55 | 474.96 |
| Ending Price/Level | $30.26 | 475.31 |
Return is based on NAV. Volatility is a statistical measure of the dispersion of returns for a particular asset or index. Beta is a measure of the volatility of an individual stock in comparison to the unsystematic risk of the entire market. Return/Risk is the relationship between the amount of return gained on an investment and the amount of risk undertaken in that investment. Max drawdown is the maximum observed loss from a peak to a trough of a portfolio, before a new peak is attained.
Performance quoted represents past performance, which is no guarantee of future results. Investment returns and principal value will fluctuate, so you may have a gain or loss when shares are sold. Current performance may be higher or lower than that quoted. Returns less than one year are cumulative. One cannot invest directly in an index.
Current figures are net of accrued outcome period expenses to date. Net figures include outcome period expenses yet to be incurred.
Fund return and current outcome period values assume reinvestment of capital gain distributions, if any. Investors purchasing the fund intra-period will achieve a different defined outcome than those who entered on day one. The remaining cap represents the maximum return the fund can achieve at its current price. The index may need to rise higher or lower than the remaining cap before the remaining cap is realized. If the remaining buffer is greater than the fund’s starting buffer, a portion of the buffer will be realized before the downside before buffer begins. After the downside before buffer has been realized, the final portion of the buffer will begin again.
For investors who like the idea of opportunistically investing in defined outcome strategies, but don’t have the time or interest in managing and monitoring a full lineup of Buffer ETFs, Managed Buffer Step-Up Strategy ETFs provide an attractive solution.
Managed Buffer Step-Up Strategy ETFs are designed to have the potential to outperform a static buffer strategy by evaluating each month for opportunities to “step up.” BSTP pursues a 9% buffer, while PSTP seeks a 15% buffer. Both ETFs are offered by Innovator. The strategies are designed to allow investors to participate in a step-up strategy without having to actively manage a Buffer ETF portfolio.
Features and Advantages:
Features
• Built-in buffers
• Risk-managed
• Reduced cap-timing risk
• Smoother overall investment experience
• Historically lower volatility relative to the S&P 500
• Potential for outperformance
• Tax-efficient rotation
• Actively managed
• Rules-based
• Easy to implement
Advantages
• Single-ticker, managed-buffer solution
• Exposure to SPY, subject to a potential limit
• Cost effective, flexible, liquid, and transparent
• Tax efficient
• No credit risk
• Rebalances periodically and can be held indefinitely
How do Step-Up Strategies work?

Step-Up ETFs begin with a one-year options portfolio. At each monthly portfolio evaluation, if a step-up threshold has not been met, the portfolio remains unchanged. If a step-up threshold has been met, the fund will roll into a new one-year options portfolio with a fresh buffer and new upside cap.
Step-Up Methodology
The Step-Up Methodology works as follows:
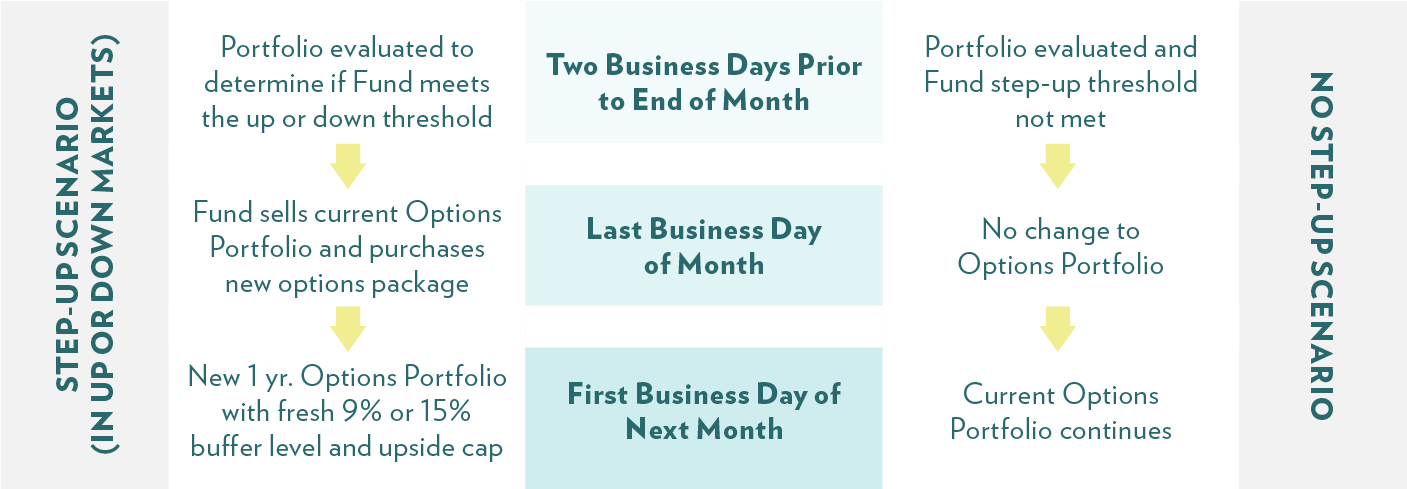
Two business days prior to the end of the month: The portfolio is evaluated to determine if a Buffer ETF has met the up or down threshold.
Last business day of the month: The ETF sells the current options portfolio and purchases a new options package.
First business day of the next month: The ETF has a new one-year options portfolio with a fresh buffer and new upside cap.
Current Thresholds:
Positive Markets
BSTP 5%
PSTP 4%
Negative Markets
BSTP -2%
PSTP -1%
Strategy Response Across Different Market Scenarios

Objectives:
• Seek to lock in gains
• Potentially increase upside
• Obtain a fresh downside buffer
• Eliminate downside-before-buffer risk
Potential Benefits of Managed Buffer Step-Up Strategy ETFs:
Capture gains and potentially mitigate downside-before-buffer risk: When the value of the ETF has increased, stepping up to the new month locks in the gain and resets the buffer.
Hypothetical Example: 1-Year 15% Buffer
- The June 2020 series offered a cap of 11.30%. After six months, the value of this basket of options had increased 7%.
- Lock in the 7% gain on the June series and step up to the December series with a cap of 9.68%
- In the first half of its outcome period, the December series exceeded the return of the June series by 3.30%.
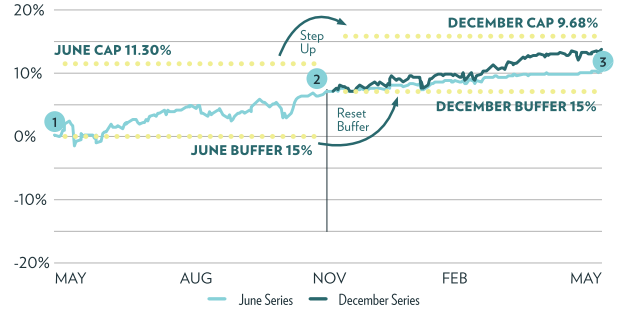
This hypothetical graph is designed to illustrate the outcomes based upon the hypothetical performances of the underlying ETF for investors who hold shares for the entirety of the outcome period and does not provide every possible performance scenario. The returns that the fund seeks to provide do not include costs associated with purchasing shares and certain expenses incurred by the fund. There is no guarantee that the fund will be successful in its attempt to provide the outcomes.
“Cap” refers to the maximum potential return, before fees and expenses and any shareholder transaction fees and any extraordinary expenses, if held over the full outcome period. “Buffer” refers to the amount of downside protection the fund seeks to provide, before fees and expenses, over the full outcome period. Outcome Period is the intended length of time over which the defined outcomes are sought.
Seek to take advantage of return dispersions: As a Buffer ETF gets closer to its cap, it has less upside potential and becomes less sensitive to increases in the value of the reference asset. A Step-Up ETF has the potential to create increased upside by moving to a higher cap and by increasing the portfolio’s sensitivity to upward moves in the reference asset.
Return dispersions create opportunities to rotate. In the hypothetical graph each ETF has a 15% buffer and SPY is the reference asset, but you can see that each ETF exhibits its own level of sensitivity to the reference asset.
Performance Can Vary Across Monthly Series of Buffer ETFs
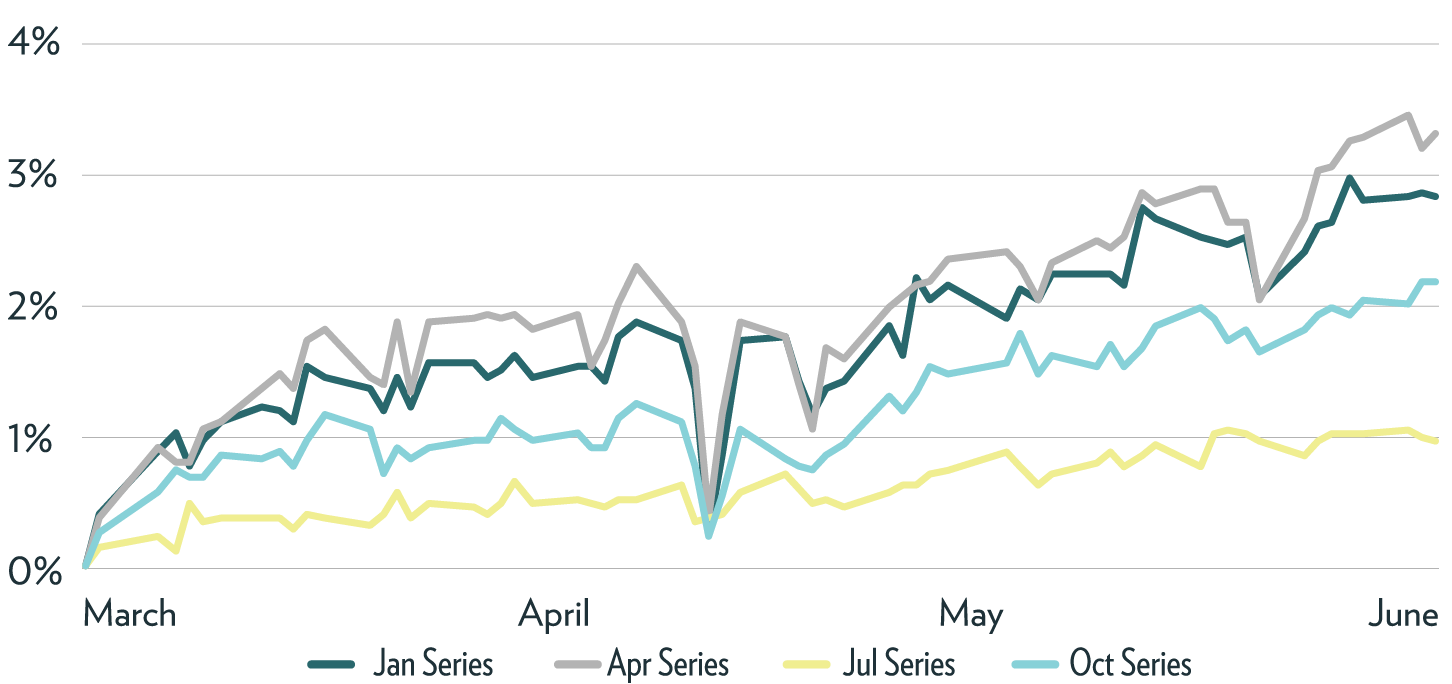
Performance quoted represents past performance, which is no guarantee of future results. Investment returns and principal value will fluctuate, so you may have a gain or loss when shares are sold. Current performance may be higher or lower than quoted.
Managed Buffer Step-Up Strategy ETFs to consider:
Managed Step-Up Strategy 9% Buffer – BSTP
The Innovator Buffer Step-Up Strategy ETF (9% Buffer) is an actively-managed ETF that seeks to provide risk-managed exposure to SPY. BSTP is a one-ticker solution designed to offer an opportunistically-managed buffer strategy. The ETF is evaluated monthly and can be held indefinitely.
At each monthly portfolio evaluation, if a step-up threshold has not been met, the portfolio remains unchanged. If a step-up threshold has been met, the fund will roll into a new one-year options portfolio with a fresh buffer and new upside cap.
Managed Step-Up Strategy 15% Buffer – PSTP
The Innovator Power Buffer Step-Up Strategy ETF (15% Buffer) is an actively-managed ETF that seeks to provide risk-managed exposure to SPY. PSTP is designed to offer an opportunistically-managed buffer strategy. The ETF is evaluated monthly and can be held indefinitely.
At each monthly portfolio evaluation, if a step-up threshold has not been met, the portfolio remains unchanged. If a step-up threshold has been met, the ETF will roll into a new one-year options portfolio with a fresh buffer and new upside cap.
Note, while Managed Buffer Step-Up Strategy ETFs seek to provide reduced cap-timing risk, a smoother overall investment experience, lower volatility, and the potential to outperform a static Buffer strategy, Managed Buffer Step-Up Strategy ETFs do not offer investors a defined outcome.
This hypothetical graphical illustration provided above is designed to illustrate the Outcomes based upon the hypothetical performances of the Underlying ETF for investors who hold Shares for the entirety of the Outcome Period and does not provide every possible performance scenario. The returns that the Fund seeks to provide do not include costs associated with purchasing Shares and certain expenses incurred by the Fund. There is no guarantee that the Fund will be successful in its attempt to provide the Outcomes.
“Cap” refers to the maximum potential return, before fees and expenses and any shareholder transaction fees and any extraordinary expenses, if held over the full Outcome Period. “Buffer” refers to the amount of downside protection the Fund seeks to provide, before fees and expenses, over the full Outcome Period. Outcome Period is the intended length of time over which the defined outcomes are sought.
Laddered Buffer ETFs are designed for investors who don’t have the time or interest in monitoring a portfolio of Buffer ETFs on an ongoing basis. Laddered Buffer ETFs provide a potential solution by offering a single-ticker ETF, with the benefits of defined outcome investing.
Innovator offers two Laddered Buffer ETFs that seek to provide exposure to a diversified portfolio of Buffer ETFs. Laddered Allocation Buffer ETF (BUFB) holds 9% Buffer ETFs and Laddered Allocation Power Buffer ETF (BUFF) holds 15% Buffer ETFs. Both invest in a laddered portfolio of 12 one-year Buffer ETFs. Both strategies offer investors a simple way to participate in a diverse set of defined outcomes, with the potential for a smoother overall investment experience. BUFF and BUFB have net annual expense ratios of 0.89%.
FT Vest offers a full lineup of Funds of Target Outcome Funds with 10%, 15%, and 25% buffers. Annual expense ratios range from 1.05% to 1.10%.
Laddered Buffer ETFs offer a built-in buffer strategy for investors that do not need a known defined outcome.
Potential Benefits of Laddered Buffer ETFs:
• Lower volatility relative to the S&P 500
• Reduced drawdowns
• Single-ticker solution
• Risk-managed
• Built-in buffers
• Easy to implement
• Tax-efficient rotation
• Rules-based
How do Laddered Buffer ETFs work?
BUFF and BUFB invest in a laddered portfolio of 12 one-year Buffer ETFs. There is an equal weight assigned to all 12 ETFs. Each month, one of the ETFs rebalances into a new outcome period.
Laddered Allocation Buffer ETF (BUFB) holds 9% Buffer ETFs and Laddered Allocation Power Buffer ETF (BUFF) holds 15% Buffer ETFs. Both invest in a laddered portfolio of 12 one-year Buffer ETFs.

Laddered Allocation 15% Power Buffer ETF (BUFF)
BUFF holds equal amounts of the 12 underlying U.S. Equity Power Buffer ETFs. The chart shows the 12 ETF holdings and their starting caps. It shows the performance of each ETF relative to the cap, buffer, and reference asset as of 3/15/2024. The chart shows the remaining upside potential and downside buffer in each position within BUFF.
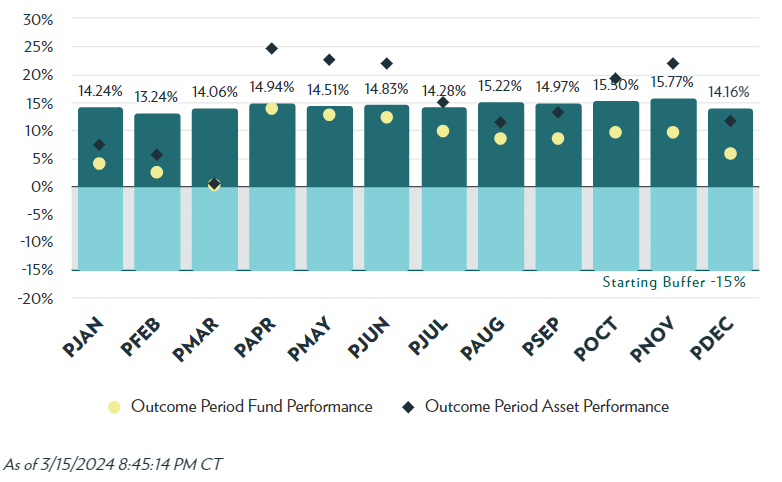
The calendar year returns over the past three years (12/31/2020 – 12/31/2023) show how BUFF performed relative to the S&P 500 and Core Bonds. BUFF lagged the S&P 500 in 2021, but nicely outperformed Core Bonds. In the 2022 bear market, BUFF greatly outperformed both the S&P 500 and Core Bonds. In 2023, BUFF showed a nice return of 16.4% while the S&P 500 surged 24.2%. Note, BUFF handily beat Core Bonds in all three calendar years.
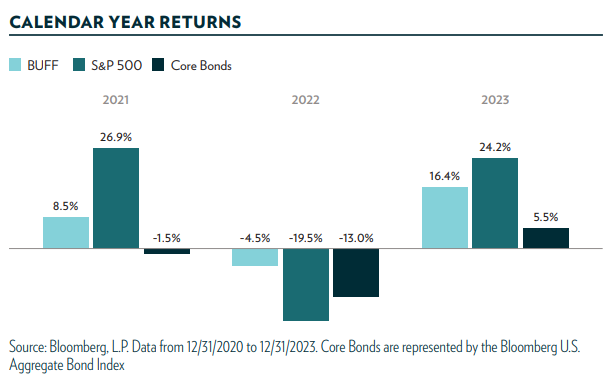
Laddered Allocation 9% Buffer ETF (BUFB)
BUFB holds equal amounts of the 12 underlying Buffer ETFs. The chart shows the 12 ETF holdings and their respective starting caps. It highlights the performance of each ETF in relation to the outcome period cap, buffer, and reference asset as of 3/15/2024. The chart shows the remaining upside potential and downside buffer in each position within BUFB.
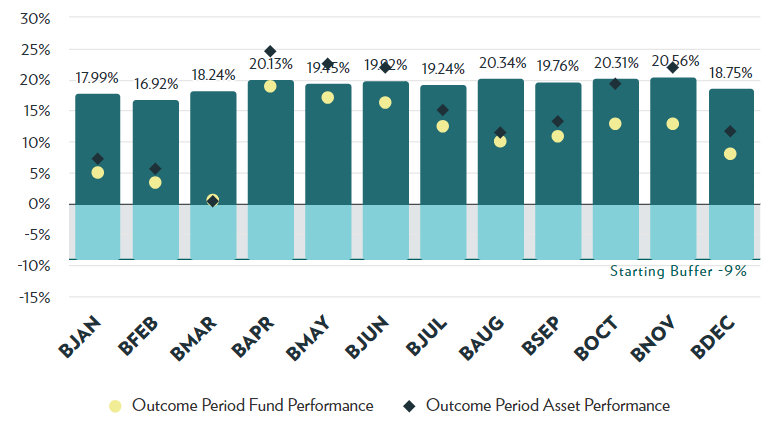
FT Vest Funds of Target Outcome Funds
FT Vest Fund of Buffer ETFs (BUFR)
With $3.7 billion in assets, BUFR is the largest Buffer ETF in the Options Trading category, as defined by Morningstar. The fund debuted on August 10, 2020. The strategy seeks to provide investors with U.S. large-cap equity market exposure while limiting downside risk through a laddered portfolio of 12 U.S. Equity Buffer ETFs. The underlying ETFs seek to provide returns that match the SPDR S&P 500 ETF Trust, up to a predetermined cap, while providing a buffer against the first 10% (before fees, expenses and taxes) of SPY losses, over a defined one-year period. On the third Friday of each month (which corresponds with options expiration), that month’s Buffer ETF resets its target outcome period with a new cap covering a new period spanning the next 12 months. The strategy’s rolling or “laddered” nature of the underlying ETFs creates diversification of investment time periods. Note, unlike the underlying ETFs, the fund itself does not pursue a target outcome strategy.
12 Diversified Outcome Periods
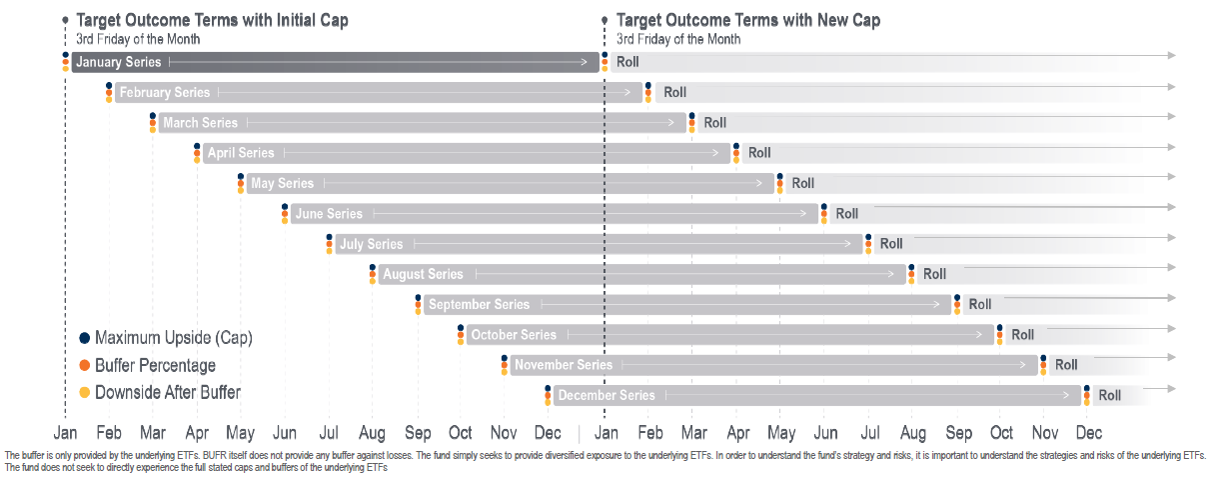
FT Vest Laddered Moderate Buffer ETF (BUFZ)
The investment strategy of the FT Vest Laddered Moderate Buffer ETF seeks to provide investors with U.S. large-cap equity market exposure while limiting downside risk through a laddered portfolio of 12 U.S. Equity Buffer ETFs. The underlying ETFs seek to provide returns that match the SPDR S&P 500 ETF Trust, up to a predetermined upside cap, while providing a buffer against the first 15% (before fees, expenses and taxes) of SPY losses, over a defined one-year period. On the third Friday of each month (which corresponds with options expiration), that month’s Buffer ETF resets its target outcome period with a new cap covering a new period spanning the next 12 months. The strategy’s rolling or “laddered” nature of the underlying ETFs creates diversification of investment time periods. Note, unlike the underlying ETFs, the fund itself does not pursue a target outcome strategy.
FT Vest Fund of Deep Buffer ETFs (BUFD)
The investment strategy of the FT Vest Fund of Deep Buffer ETFs seeks to provide investors with US large cap equity market exposure while limiting downside risk through a laddered portfolio of 12 U.S. Equity Deep Buffer ETFs. The underlying ETFs seek to provide returns that match the SPDR S&P 500 ETF Trust, up to a predetermined upside cap, while providing a buffer against SPY losses (-5% to -30%), before fees, expenses and taxes, over a defined one-year period. On the third Friday of each month (which corresponds with options expiration), that month’s Buffer ETF resets its target outcome period with a new cap covering a new period spanning the next 12 months. The strategy’s rolling or “laddered” nature of the underlying ETFs creates diversification of investment time periods. Note, unlike the underlying ETFs, the fund itself does not pursue a target outcome strategy.
FT Vest Fund of Nasdaq-100 Buffer ETFs (BUFQ)
The investment strategy of the FT Vest Fund of Nasdaq-100 Buffer ETFs seeks to provide investors with large-cap equity market exposure while attempting to limit downside risk through a laddered portfolio of four Nasdaq-100® Buffer ETFs. The underlying ETFs seek to provide investors with returns (before fees, expenses and taxes) that match the price return of the Invesco QQQ Trust, Series 1 (“QQQ”), up to a predetermined upside cap, while providing a buffer against the first 10% (before fees, expenses and taxes) of QQQ losses, over a defined one-year period. The buffer is only provided by the underlying ETFs and the fund itself does not provide any stated buffer against losses. On the third Friday of every third month (December, March, June, and September), which corresponds with options expiration, that month’s Buffer ETF resets its target outcome period with a new cap covering a new period spanning the next 12 months.
Similar to the Managed Buffer Step-Up Strategy ETFs reviewed in the previous section, Laddered Buffer ETFs offer a potential solution for investors who don’t have the time, interest or resources to continually monitor a portfolio of Buffer ETFs. Although they offer many potential benefits, do recognize that unlike most Buffer ETFs, Laddered Buffer ETFs do not offer investors a defined outcome.
Accelerated Buffer ETFs seek to provide 2x the upside of the SPDR S&P 500 ETF Trust (SPY), to a cap, with approximately single exposure on the downside, but with a buffer against the first 9% or 15% loss, over a one-year outcome period.
FT Vest refers to its “accelerated” ETF offerings as “Enhance & Moderate.” They provide 2x upside participation, to a cap, with a 15% downside buffer (before fees). There is a FT Vest U.S. Equity Enhance & Moderate Buffer series for every month. The annual expense ratio is 0.85%.
Innovator offers a U.S. Equity Accelerated 9 Buffer ETF for January, April, July, and October. These ETFs provide 2x upside participation, to a cap, with a 9% downside buffer (before fees). The annual expense ratio is 0.79%.
Accelerated Buffer ETFs offer many potential benefits:
• 2x the upside return of SPY, to a cap
• Buffer against the first 9% or 15% loss
• Benchmark outperformance, to a cap, with less downside risk
• A known outcome range prior to investing
• Liquid and transparent
• No credit risk
• Tax efficient
• Automatically rebalance annually
• Seek to reduce the risk of lower equity returns and provide a known potential return range without added downside risk
Who should consider owning Accelerated Buffer ETFs?
Accelerated Buffer ETFs should appeal to conservative or moderate-risk investors who believe we are in a low-growth stock market environment that could produce single-digit annual returns. Why? Because if the reference asset finishes the outcome period (assuming a purchase on the reset date) below the cap, but still positive, the return will be doubled, up to a maximum return level equal to the cap, after fees.
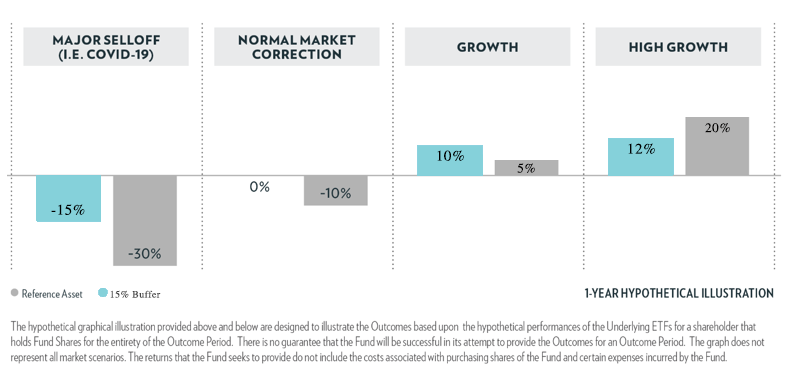
The chart shows hypothetical return scenarios for the reference asset (SPY) and an Accelerated Buffer ETF. We’ll assume the ETF provides 15% downside protection and a hypothetical upside cap of 12% (before fees). The chart shows potential hypothetical outcomes across different scenarios. The examples assume an investor purchased the ETF on the first day of the outcome period and held until the end of the period.
In a major market selloff of -30%, the ETF would lose 15%, before fees. In a normal market correction of -10%, the ETF would break even. If SPY finished the outcome period in positive territory, then the ETF’s return would double, up to the 12% cap. For example, if SPY returned 5%, the ETF would show an approximate return of 10%. If SPY returned 7%, the ETF would show an approximate return of 12%, at its cap. And, if SPY showed a high return and finished the outcome period up 20%, the ETF would again be capped out with a return of 12%.
Conservative or moderate-risk investors who believe the stock market will produce single-digit, average annual returns, should find Accelerated Buffer ETFs appealing. Visit the issuing company’s website, www.ftportfolios.com or www.innovatoretfs.com, to view the potential outcome parameters prior to making a purchase.
Accelerated Buffer ETFs to consider:
FT Vest U.S. Equity Enhance & Moderate Buffer ETF – Reference Asset: SPY
XJAN 15% Enhance & Moderate Buffer – January
XFEB 15% Enhance & Moderate Buffer – February
XMAR 15% Enhance & Moderate Buffer – March
XAPR 15% Enhance & Moderate Buffer – April
XMAY 15% Enhance & Moderate Buffer – May
XJUN 15% Enhance & Moderate Buffer – June
XJUL 15% Enhance & Moderate Buffer – July
XAUG 15% Enhance & Moderate Buffer – August
XSEP 15% Enhance & Moderate Buffer – September
XOCT 15% Enhance & Moderate Buffer – October
XNOV 15% Enhance & Moderate Buffer – November
XDEC 15% Enhance & Moderate Buffer – December
Innovator U.S. Equity Accelerated 9 Buffer ETF – Reference Asset: SPY
XBJA 9% Buffer – January
XBAP 9% Buffer – April
XBJL 9% Buffer – July
XBOC 9% Buffer – October
Allianz has recently launched an exciting new offering in the Buffer ETF space. Allianz refers to its first Uncapped Buffer ETF as AllianzIM U.S. Equity Buffer 15 Uncapped ETF – April (ARLU). Allianz plans to introduce an Uncapped Buffer ETF for every month of the year. So, what’s so exciting about an Uncapped Buffer ETF? Read on.
Allianz’s Uncapped Buffer ETFs offer investors all the benefits of traditional Buffer ETFs, but without an upside cap. Yes, you read that correctly, “without” an upside cap. How is that possible and what’s the trade-off? Well, the trade-off is what is referred to as the “spread.” For shareholders who purchase an Uncapped Buffer ETF on its reset date, the reference asset (SPY) must earn a positive return above a predetermined spread, at the end of the outcome period, before the ETF will start to participate in gains. The spread will vary depending on the same factors (volatility and interest rates) that influence the upside caps of traditional Buffer ETFs.
ARLU debuted on April 1, 2024 with a gross spread of 2.96% (3.70% net). So, an investor who purchased ARLU on the reset date will not participate in any gains of the reference asset (SPY) unless its return exceeds 3.70% at the end of the 12-month outcome period. Note, ARLU could show positive intra-outcome returns at any given time, but for a shareholder who bought on the reset day to show a profit at the end of the outcome period, the reference asset’s return must exceed the spread.
Let’s look at a hypothetical return scenario for a shareholder of ARLU over the coming outcome period. ARLU begins the outcome period with a 15% buffer and a net spread of 3.70%. The investor is protected from the first 15% loss, but the spread percentage indicates the investor will forgo any positive return of the reference asset up to 3.70%. For example, if the reference asset (SPY) returns 10% during the outcome period, ARLU would gain approximately 6.30%. And, if the reference asset returns 3.70% or less, an ARLU shareholder will not profit.
So, what’s the attraction of an Uncapped Buffer ETF if a shareholder has to potentially forgo a few percentage points or more, when the reference asset delivers a positive return at the end of each outcome period? Well, if you consider the historical annual returns of the S&P 500 (see chart), it’s clear that the largest percentage of returns are periods where the index does substantially better than average. An Uncapped Buffer ETF would allow a shareholder to participate in unlimited upside (minus the spread) during the years when there is considerable outperformance of the index. This is extremely attractive and at times these ETFs could greatly outperform traditional Buffer ETFs that have limited profit potential because of the upside caps.
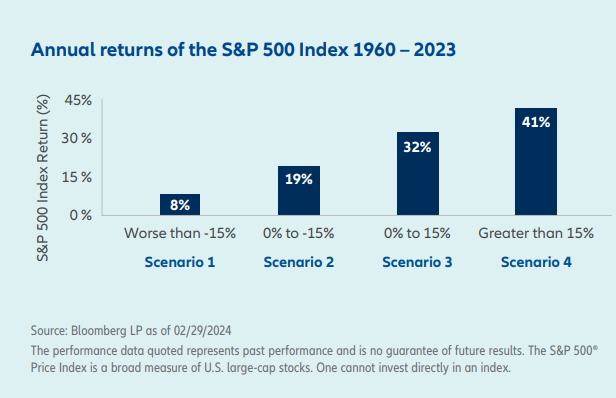
Take a look at the annual returns of the S&P 500 in the chart. It’s fascinating to see how the long-term average return of the index is so heavily influenced by periods of exceptionally high returns (Scenario 4). 41% of the annual returns of the S&P 500 exceeded 15%. When the index does well, it often does extremely well, and outperforms the long-term average return of the index by a significant amount. The average annual return when the S&P 500 is up more than 15% has been 24.10%. That’s more than 2x the historical average annual return of the index!
Potential Return Scenarios for an Uncapped Buffer ETF:
Here are various potential return scenarios using historical data for the S&P 500 (1960-2023):
Scenario 1: If the S&P 500 were to lose 15% or more in a calendar year, the 15% buffer would help mitigate losses. The average annual return for the S&P 500 when losses were worse than -15% was -25.70%, which means the average loss to an investor with a 15% buffer would have been -10.70% (before fees).
Scenario 2: Since 1960, 19% of observations resulted in a loss between zero and -15%. In this scenario, before fees and expenses, an investor would not have incurred a loss.
Scenario 3: In years when the S&P 500 had returns between zero and 15%, an investor would participate in the upside only above the spread. For example, if the net spread was 3.75% and the reference index (SPY) finished the outcome period up 14%, the investor’s return would be 10.25% (14% – 3.75% = 10.25%).
Scenario 4: Perhaps surprisingly, the most common return-period scenario is when returns exceed 15%. Throughout history, when the S&P 500’s annual return was greater than 15%, its average return was a robust 24.10%. The uncapped feature of these Buffer ETFs would allow an investor to have unlimited participation in the gains, above the spread. For example, if the net spread was 4% and the reference asset (SPY) returned 24% during the outcome period, the investor would earn 20% (24% – 4% = 20%).
Uncapped Buffer ETFs offer many potential benefits:
• Unlimited upside participation in the market after the spread
• A buffer against the first 15% loss
• A new spread and fresh buffer every 12 months
• A known outcome range prior to investing
• Liquid and transparent
• No credit risk
• Tax efficient
• Automatically rebalance every 12 months
• Potentially higher returns than traditional Buffer ETFs during years when the returns of the S&P 500 far exceed long-term average returns
• Potentially higher returns for buy-and-hold investors than traditional Buffer ETFs with a capped upside
• An attractive core long-term holding with high upside potential and moderate downside protection
Uncapped Buffer ETF Payoff Profile
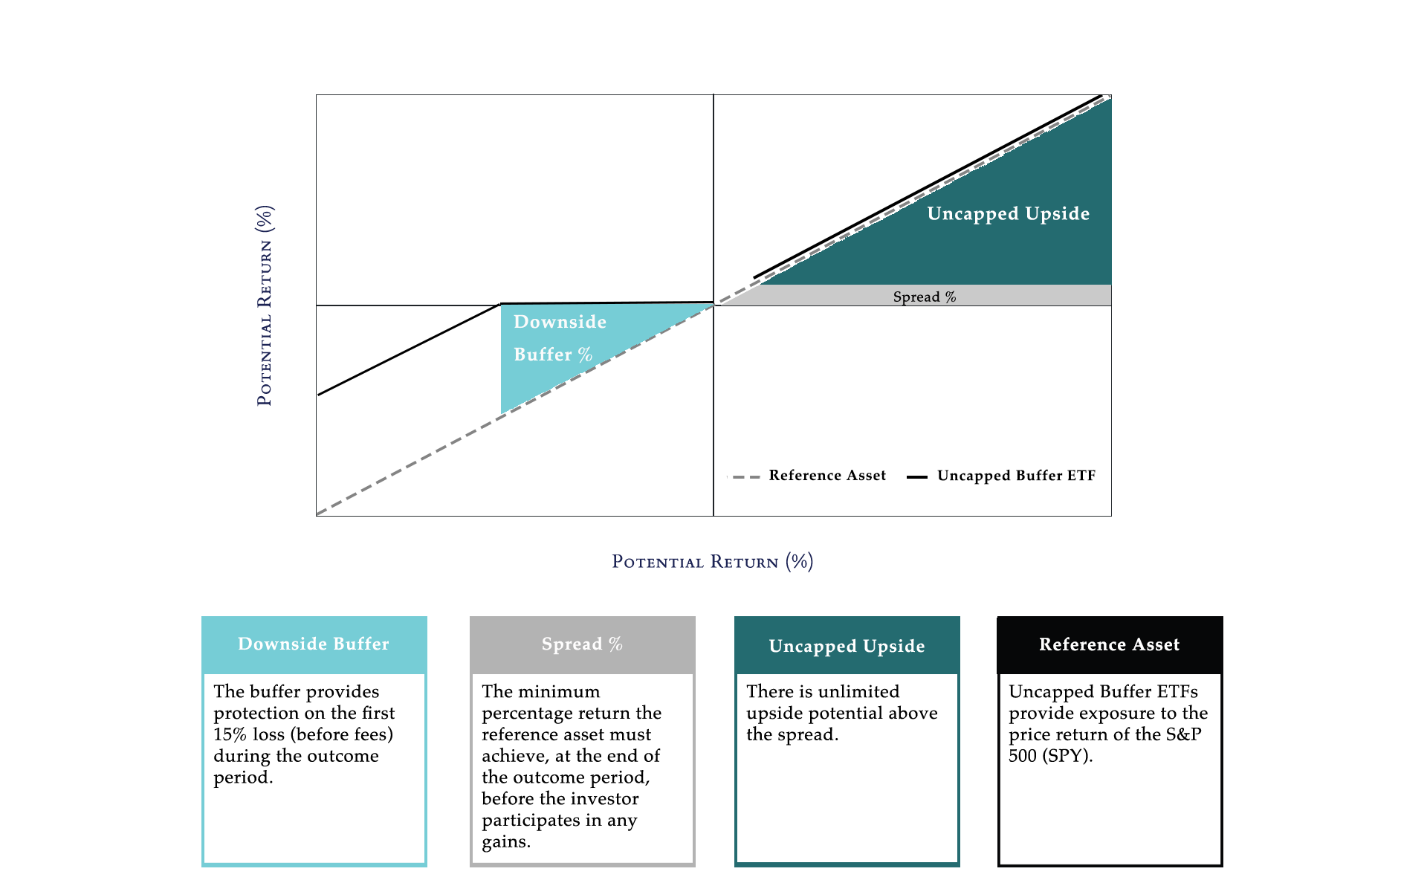
The chart shows the payoff profile of an Uncapped Buffer ETF. Here are the four components that determine the payoff profile:
1. Downside Buffer: The buffer provides protection on the first 15% loss (before fees) during the outcome period.
2. Spread: For investors purchasing an Uncapped Buffer ETF on the reset date, the spread represents the minimum percentage return the reference asset must achieve, at the end of the outcome period, before the investor participates in any gains.
3. Uncapped Upside: There is unlimited upside potential above the spread.
4. Reference Asset: Uncapped Buffer ETFs provide exposure to the price return of SPY.
When is the ideal time to buy an Uncapped Buffer ETF?
In my opinion, the ideal time to buy an Uncapped Buffer ETF is when stock prices are depressed, sentiment is extremely negative, and stock valuations are attractive. This would typically be during deep corrections or bear markets. History has shown that markets can often post outsized gains coming out of bear markets, so an Uncapped Buffer ETF could be super attractive. And, because it’s impossible to know the trough of a bear market in advance, the 15% buffer should give investors the courage to step in and buy when they might otherwise be too uncomfortable to enter the market.
Obviously, it’s very difficult to know when markets are poised to deliver above-average returns, but an investor can certainly increase the odds of success by buying an Uncapped Buffer ETF when stock prices are already depressed and trading well below their all-time highs.
Five Biggest Market Declines and Subsequent Five-Year Periods (1929-2023)
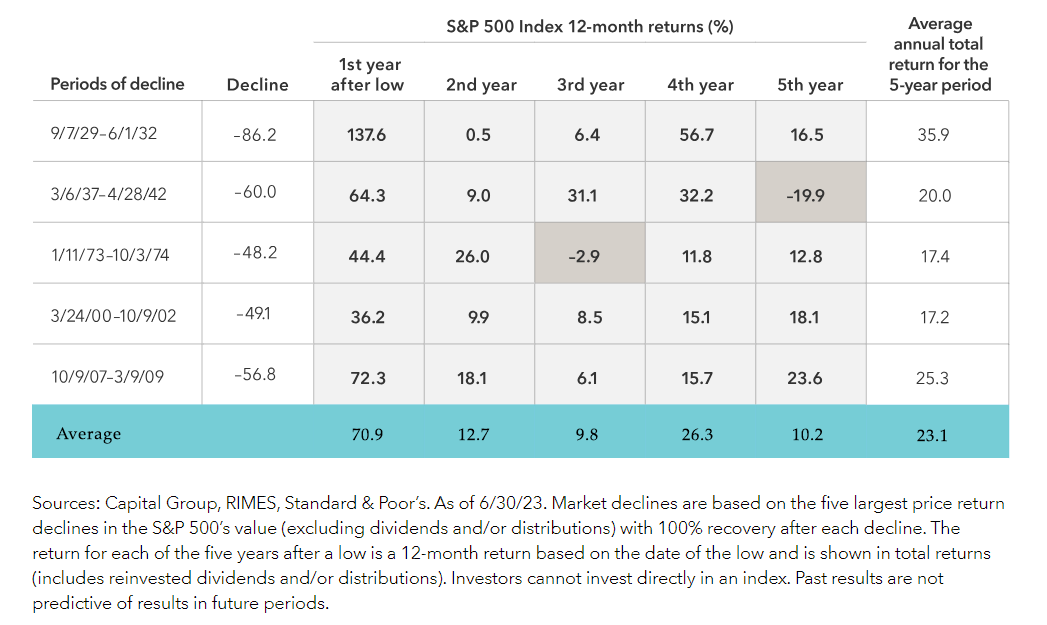
Take a look in the table at the column titled “1st Year After Low.” It shows the returns of the S&P 500 in the first year following the worst bear markets in history. Returns have often been strongest after the sharpest declines, bouncing back quickly from market bottoms. The average first year return (after the low) following the five biggest market declines in history was an astonishing 70.9%! If you own a capped Buffer ETF coming out of a deep bear market, and stocks recover strongly, you could unfortunately be capped out early in the recovery. On the other hand, an Uncapped Buffer ETF would allow you to capture most of the outsized gains, given its unlimited profit potential above the spread, during each outcome period.
What type of investor would find an Uncapped Buffer ETF attractive?
Uncapped Buffer ETFs should appeal to conservative, moderate or aggressive investors. The downside buffer will give the risk-averse investor some comfort and the unlimited upside potential, above the spread, is attractive for all investors.
What are the disadvantages of an Uncapped Buffer ETF?
The primary disadvantage of an Uncapped Buffer ETF is not being able to participate in the initial gains of the reference asset due to the spread. If we are in a single-digit, low-return stock market environment, and returns are below average, owning an Uncapped Buffer ETF would not be ideal. Why? Because if stock returns are positive, but below 10%, then you wouldn’t want to give up a large percentage of your returns. For example, if the S&P 500 provides an average annual return of 7% in the coming years, and the spread averages 3.5% net, you could only make as little as 3.5% annually (returns will vary during each outcome period). In this hypothetical return scenario, you would forgo half the gain of the reference asset.
In a low-return environment, Uncapped Buffer ETFs would likely not be as attractive as most traditional Buffer ETFs. Unfortunately, it’s nearly impossible to predict when forward returns are going to be below average, so you may decide to always have a dedicated long-term allocation in Uncapped Buffer ETFs.
Which factor will influence the spread percentage more, volatility or interest rates?
It is anticipated that the spread percentage is likely to be more heavily influenced by changes in interest rates than changes in volatility. In a declining rate environment, it’s likely that spreads will widen, and in a rising rate environment, spreads should narrow. Volatility will also play a role in determining the spread percentage and can offset rate movements one way or the other.
Which option contracts are held in an Uncapped Buffer ETF?
In a “traditional” Buffer ETF there are four options held in the ETF wrapper. There is a put spread (purchase and sale of put options) that creates the downside protection, a call option that creates synthetic exposure 1:1 to the reference asset, and a sale of a call option that creates the upside cap. With an Uncapped Buffer ETF there are only three option contracts held. A put spread creates the downside protection of 15% and sets the return spread level/threshold. The long put is bought approximately 3% in-the-money (in the current market environment) vs. at-the-money for traditional Buffer ETFs with a cap. A long call option creates 1:1 synthetic exposure to SPY. Note, there is no sale of a call option, so the upside is uncapped.
What spread percentage would make Uncapped Buffer ETFs unattractive?
This is somewhat subjective and the answer will depend on your opinion of the market environment, and its forward return potential. If we are deep in a bear market and the upside profit potential is very high – as is usually the case when prices are very depressed – then a spread of 4% or higher may still make for an attractive investment opportunity. The reason is that even if you forgo the first 4% profit on the upside, due to the spread, your returns could still exceed “capped” Buffer ETFs if the market greatly outperforms to the upside coming out of a bear market.
Historical data (1970-2023) from Morningstar Direct, using various spread percentages, showed that a 4% spread still allowed for upside capture of 78% of the S&P 500’s gains, and a 6% spread showed upside capture of 68% (excluding the impact of fees).
Buffer 15 Uncapped Historical Upside/Downside Capture (1970-2023)
| Buffer 15 Uncapped | 2% Spread | 3% Spread | 4% Spread | 6% Spread |
| Up Market Capture | 88% | 83% | 78% | 68% |
| Down Market Capture | 29% | 29% | 29% | 29% |
It is important to note that you should never buy an Uncapped Buffer ETF with the expectation that you will outperform the market. You buy a buffer because you are not comfortable taking on all the downside risk of the S&P 500 – you want some protection. However, while you shouldn’t expect to outperform with an Uncapped Buffer ETF, in certain markets, over multiple years, it could happen.
The combination of a 15% buffer and uncapped upside above the spread, allows you to participate in strong equity returns and market rallies. Uncapped Buffer ETFs offer the potential to generate exceptional performance, not only over a specific 12-month outcome period, but over multiple years. In addition, you have downside protection on the first 15% loss from each reset date. Moderate protection plus unlimited upside, above the spread, is an attractive combination.
Uncapped Buffer ETFs vs. Capped Buffer ETFs
Let’s compare hypothetical returns of an Uncapped Buffer ETF to a capped version. We’ll assume both ETFs provide a 15% buffer at the start of each outcome period. In this hypothetical example, the traditional Buffer ETF has an upside cap of 14% (before fees) and the Uncapped Buffer ETF has a spread of 3% (before fees). We’ll assume the S&P 500 pays annual dividend income of 1.7%.
Scenario 1: S&P 500 finishes inside the spread with a return of 2%.
| Scenario Recap | Price Return | Income Return | Total Return |
| S&P 500 | 2% | 1.7% | 3.7% |
| Buffer ETF | 2% | 0% | 2% |
| Uncapped Buffer ETF | 0% | 0% | 0% |
Scenario 2: S&P 500 finishes below the spread, but inside the buffer, losing 14%.
| Scenario Recap | Price Return | Income Return | Total Return |
| S&P 500 | -14% | 1.7% | -12.3% |
| Buffer ETF | 0% | 0% | 0% |
| Uncapped Buffer ETF | 0% | 0% | 0% |
Scenario 3: S&P 500 finishes below the spread and below the buffer, losing 20%.
| Scenario Recap | Price Return | Income Return | Total Return |
| S&P 500 | -20% | 1.7% | -18.3% |
| Buffer ETF | -5% | 0% | -5% |
| Uncapped Buffer ETF | -5% | 0% | -5% |
Scenario 4: S&P 500 finishes above the spread, but below the cap, with a 12% return.
| Scenario Recap | Price Return | Income Return | Total Return |
| S&P 500 | 12% | 1.7% | 13.7% |
| Buffer ETF | 12% | 0% | 12% |
| Uncapped Buffer ETF | 9% | 0% | 9% |
Scenario 5: S&P 500 finishes above the spread and above the cap, with a return of 30%.
| Scenario Recap | Price Return | Income Return | Total Return |
| S&P 500 | 30% | 1.7% | 31.7% |
| Buffer ETF | 14% | 0% | 14% |
| Uncapped Buffer ETF | 27% | 0% | 27% |
Uncapped Buffer ETFs have one of the most intriguing payoff profiles in the Buffer ETF space. Please consider these offerings, particularly when stock prices are depressed and trading at historically attractive valuations.