The Bear-to-Bull Market period of 2022-2023 provides an excellent case study that highlights how Buffer ETFs can preserve wealth in a declining market, but also participate nicely during a rebound at the start of a new bull market. In this section we’ll see how Innovator’s Buffer ETFs (January series) performed relative to the reference asset, SPY, during this two-year period.
Innovator U.S. Equity Buffer – January (BJAN)
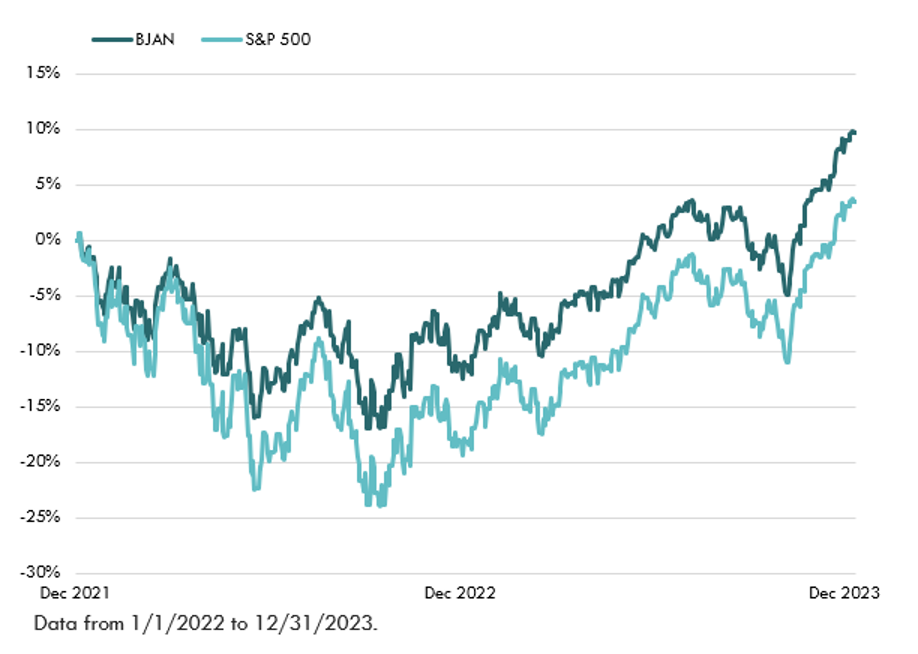
You can see in the graph and table below that during the two-year period, BJAN mostly tracked its reference asset higher, and with similar volatility. At the start of each outcome period, BJAN provided a buffer against the first 9% loss (gross of fees).
BJAN returned 4.68% during the two-year period while SPY returned 1.70%. BJAN showed a maximum drawdown of -17.38% compared to SPY’s maximum drawdown of -25.36%.
Summary: BJAN provided a buffer against losses during the 2022 bear market and actually outperformed the reference asset (SPY) by 3% over the full two-year period.
BJAN: January 1, 2022 – December 31, 2023
| 1/1/2022 – 12 /31/2023 | BJAN | SPY |
| Return | 4.68% | 1.70% |
| Volatility | 15.10% | 19.50% |
| Beta | 0.95 | 1.00 |
| Return/Risk | 0.31 | 0.09 |
| Max Drawdown | -17.38% | -24.50% |
| Starting Price/Level | $37.28 | 474.96 |
| Ending Price/Level | $40.88 | 475.31 |
Innovator U.S. Equity Power Buffer – January (PJAN)
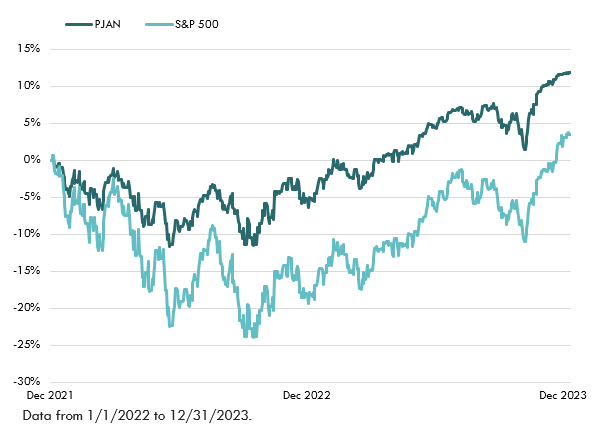
The graph and table below show PJAN tracked its reference asset higher during the two-year period, but with quite a bit less volatility (0.69 beta). The result was a smoother ride for shareholders compared to holding SPY without any downside protection. At the start of each outcome period, PJAN provided a buffer against the first 15% loss (gross of fees).
PJAN returned 5.8% during the two-year period while SPY returned 1.70%. PJAN showed a maximum drawdown of -11.90% compared to SPY’s maximum drawdown of -25.36%.
Summary: PJAN provided a buffer against losses during the 2022 bear market and outperformed the reference asset (SPY) by 4.1% over the full two-year period.
PJAN: January 1, 2022 – December 31, 2023
| 1/1/2022 – 12 /31/2023 | PJAN | SPY |
| Return | 5.80% | 1.70% |
| Volatility | 11.30% | 19.50% |
| Beta | 0.69 | 1.00 |
| Return/Risk | 0.51 | 0.09 |
| Max Drawdown | -11.90% | -24.50% |
| Starting Price/Level | $33.25 | 474.96 |
| Ending Price/Level | $37.21 | 475.31 |
Innovator U.S. Equity Ultra Buffer – January (UJAN)
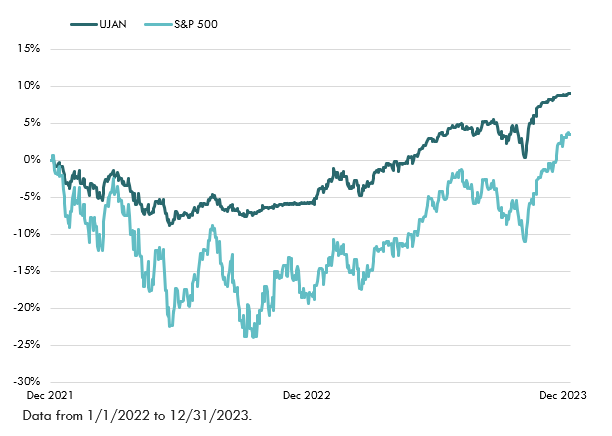
The graph and table below show UJAN tracked the reference asset lower in 2022, but with significantly less volatility (0.36 beta). Its return mostly hugged the -5% level during the 2022 bear market and then it participated nicely during the bull market in 2023. The overall result for shareholders was a much smoother ride compared to holding SPY without any downside protection. At the start of each outcome period, UJAN provided a buffer against a 30% loss (gross of fees), but shareholders were not protected from the first 5% loss. The buffer protects from -5% to -35%.
UJAN returned 4.4% during the two-year period while SPY returned 1.7%. UJAN showed a maximum drawdown of -8.8% compared to SPY’s maximum drawdown of -25.36%.
Summary: UJAN provided a buffer against losses during the 2022 bear market and outperformed the reference asset (SPY) by 2.7% over the full two-year period.
UJAN: January 1, 2022 – December 31, 2023
| 1/1/2022 – 12 /31/2023 | UJAN | SPY |
| Return | 4.40% | 1.70% |
| Volatility | 6.90% | 19.50% |
| Beta | 0.36 | 1.00 |
| Return/Risk | 0.64 | 0.09 |
| Max Drawdown | -8.80% | -24.50% |
| Starting Price/Level | $31.56 | 474.96 |
| Ending Price/Level | $34.40 | 475.31 |
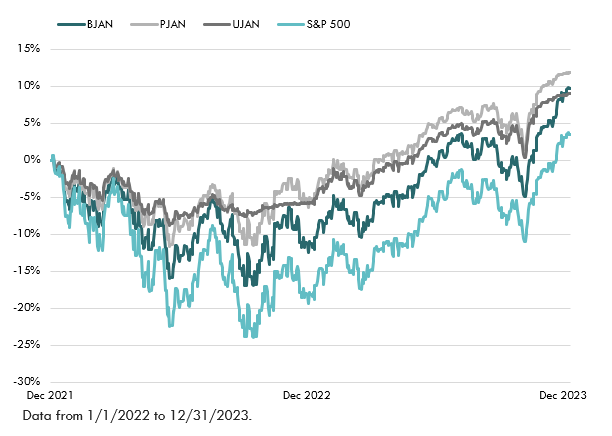
It’s worth noting that all three Innovator January Buffer ETF series, with their various levels of downside protection and upside caps, were able to outperform SPY during the full two-year, bear-to-bull period. See the graph below. The data provide evidence of the added value of losing less during a bear market (2022), thanks to the downside protection provided by Buffer ETFs, and also how shareholders can participate nicely during a strong market rebound (2023).
BJAN, PJAN, UJAN: January 1, 2022 – December 31, 2023
Return is based on NAV. Volatility is a statistical measure of the dispersion of returns for a particular asset or index. Beta is a measure of the volatility of an individual stock in comparison to the unsystematic risk of the entire market. Return/Risk is the relationship between the amount of return gained on an investment and the amount of risk undertaken in that investment. Max drawdown is the maximum observed loss from a peak to a trough of a portfolio, before a new peak is attained.
Performance quoted represents past performance, which is no guarantee of future results. Investment returns and principal value will fluctuate, so you may have a gain or loss when shares are sold. Current performance may be higher or lower than that quoted. Returns less than one year are cumulative. One cannot invest directly in an index.
Current figures are net of accrued Outcome Period expenses to date. Net figures include Outcome Period expenses yet to be incurred.
Fund return and current outcome period values assume reinvestment of capital gain distributions, if any. Investors purchasing the fund intra-period will achieve a different defined outcome than those who entered on day one. The remaining cap represents the maximum return the fund can achieve at its current price. The index may need to rise higher or lower than the remaining cap before the remaining cap is realized. If the remaining buffer is greater than the fund’s starting buffer, a portion of the buffer will be realized before the downside before buffer begins. After the downside before buffer has been realized, the final portion of the buffer will begin again.