Let’s look at a case study of the 2023 bull market and how Innovator’s Buffer ETFs (January series) performed. Did they perform in line with the defined outcome parameters indicated at the start of the outcome period? Absolutely.
Let’s review the 2023 performance of the 9%, 15% and 30% (-5% to -35%) Buffer ETFs, relative to their reference asset, SPY (S&P 500).
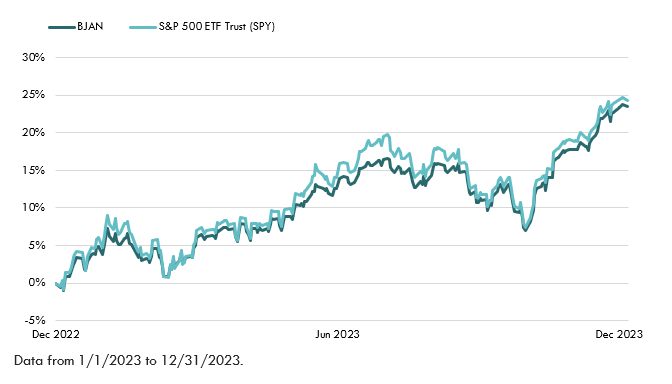
Innovator U.S. Equity Buffer – January (BJAN)
You can see in the graph and table below that during the outcome period, BJAN tracked its reference asset higher, but with less volatility (0.80 beta). At the start of the outcome period, BJAN provided a buffer against the first 9% loss (gross of fees), but with the benefit of hindsight, the buffer wasn’t needed in 2023. The upside cap at the start of the outcome period was indicated at 25.06%.
BJAN returned 23.48% during the outcome period while SPY returned 24.28%. BJAN showed a maximum drawdown of -8.22%, compared to SPY’s maximum drawdown of -10.29%.
Summary: BJAN tracked the performance of its reference asset closely during the outcome period, and only slightly underperformed SPY in 2023, while also providing some downside protection.
BJAN: January 1, 2023 – December 31, 2023
| 1/1/2023 – 12 /31/2023 | BJAN | SPY |
| Return | 23.48% | 24.28% |
| Volatility | 10.67% | 13.16% |
| Beta | 0.80 | 1.00 |
| Return/Risk | 2.20 | 1.85 |
| Max Drawdown | -8.22% | -10.29% |
| Starting Price/Level | $33.11 | 382.44 |
| Ending Price/Level | $40.88 | 475.31 |
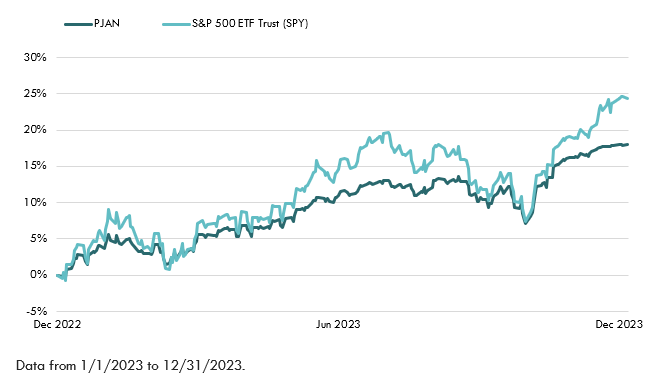
Innovator U.S. Equity Power Buffer – January (PJAN)
The graph and table below show PJAN mostly tracked its reference asset higher in 2023, but with less volatility (0.54 beta). The result was a smoother ride for shareholders, but with some underperformance, which is to be expected in a strong market. At the start of the outcome period, PJAN provided a buffer against the first 15% loss (gross of fees). The upside cap at the start of the outcome period was indicated at 18.84%.
PJAN returned 18.05% during the outcome period while SPY returned 24.28%. PJAN showed a maximum drawdown of -5.75%, compared to SPY’s maximum drawdown of -10.29%.
Summary: PJAN tracked the performance of its reference asset closely during the outcome period, as expected, but lagged the performance of SPY by 6.24%, due to the upside cap having been surpassed by the performance of SPY.
PJAN: January 1, 2023 – December 31, 2023
| 1/1/2023 – 12 /31/2023 | PJAN | SPY |
| Return | 18.05% | 24.29% |
| Volatility | 7.62% | 13.16% |
| Beta | 0.54 | 1.00 |
| Return/Risk | 2.37 | 1.85 |
| Max Drawdown | -5.75% | -10.29% |
| Starting Price/Level | $31.52 | 382.43 |
| Ending Price/Level | $37.21 | 475.31 |
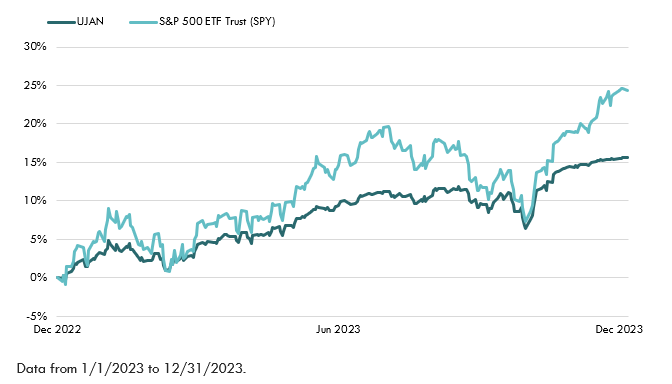
Innovator U.S. Equity Ultra Buffer – January (UJAN)
The graph and table below show UJAN mostly tracked its reference asset higher in 2023, but with much less volatility (0.46 beta). The result was a very smooth ride, but also some meaningful underperformance. At the start of the outcome period, UJAN provided a buffer against a 30% loss (-5% to -35%), but obviously the buffer was not needed in 2023. The upside cap at the start of the outcome period was indicated at 16.4%.
UJAN returned 15.6% during the outcome period while SPY returned 24.28%. UJAN showed a maximum drawdown of -4.87%, compared to SPY’s maximum drawdown of -10.29%.
Summary: UJAN tracked the performance of its reference asset closely during most of the outcome period, as expected, but lagged the performance of SPY by 8.69%, due to the upside cap having been surpassed by the performance of SPY.
UJAN: January 1, 2023 – December 31, 2023
| 1/1/2023 – 12 /31/2023 | UJAN | SPY |
| Return | 15.60% | 24.29% |
| Volatility | 6.56% | 13.16% |
| Beta | 0.46 | 1.00 |
| Return/Risk | 2.38 | 1.85 |
| Max Drawdown | -4.87% | -10.29% |
| Starting Price/Level | $29.75 | 382.43 |
| Ending Price/Level | $34.40 | 475.31 |
With the benefit of hindsight, an investor would have obviously wanted the least amount of protection in 2023, which would have provided the highest upside cap. BJAN would have been the ideal choice in 2023 since its upside cap allowed for nearly full participation in the market’s gains.
What’s critical to note is the Buffer ETFs all performed “as advertised” and in line with the published defined outcome parameters.
Return is based on NAV. Volatility is a statistical measure of the dispersion of returns for a particular asset or index. Beta is a measure of the volatility of an individual stock in comparison to the unsystematic risk of the entire market. Return/Risk is the relationship between the amount of return gained on an investment and the amount of risk undertaken in that investment. Max drawdown is the maximum observed loss from a peak to a trough of a portfolio, before a new peak is attained.
Performance quoted represents past performance, which is no guarantee of future results. Investment returns and principal value will fluctuate, so you may have a gain or loss when shares are sold. Current performance may be higher or lower than that quoted. Returns less than one year are cumulative.
Current figures are net of accrued Outcome Period expenses to date. Net figures include Outcome Period expenses yet to be incurred.
Fund return and current outcome period values assume reinvestment of capital gain distributions, if any. Investors purchasing the fund intra-period will achieve a different defined outcome than those who entered on day one. The remaining cap represents the maximum return the fund can achieve at its current price. The index may need to rise higher or lower than the remaining cap before the remaining cap is realized. If the remaining buffer is greater than the fund’s starting buffer, a portion of the buffer will be realized before the downside before buffer begins. After the downside before buffer has been realized, the final portion of the buffer will begin again.