2017 All-Weather Portfolio
According to City-Data.com, the most recent reported average household income in zip code 90274 was $188,000. 57% of the tax filers showed dividend income which would indicate stock ownership. For zip code 90275, the average household income was $117,000 with 47% reporting dividend income. If you factor in the number of residents on the Palos Verdes Peninsula who have company sponsored 401ks or other retirement plans, where dividends are sheltered and unreported, my best guess tells me that close to 70% of the households in 90274 own stocks and probably 60% or higher in 90275.
Given the high level of stock ownership in our wealthy community, it’s baffling to me how little concern there is about the level of stock valuations and the potential for loss in the coming years. Indeed, complacency reigns despite stock portfolios being bloated from an 8-year bull market that has pushed valuations close to the second highest in history. The Shiller CAPE ratio (cyclically-adjusted price-to-earnings) indicates current stock valuations are at 29.2, essentially the highest reading in history except for the Tech Bubble in 2000. Stocks are now priced well above the bubble in the late 1960s (Nifty-Fifty Bubble), beyond the stock bubble of 2007 that led to a 55% collapse in stocks, and equal to the bubble that was followed by the Great Depression in the late 1920s (stocks subsequently lost 80% of their value). Really, the only period in history when stocks were clearly more expensive was during the Tech Bubble of 2000 – and we know that also ended with a 50% haircut to major stock indices.
It’s not only the CAPE Ratio that indicates stocks are back in bubble territory. Price-to-book value also shows stocks at the highest reading in history other than the Tech Bubble. And, the price-to-sales ratio is above where it was during all prior bubbles while the dividend yield on the S&P 500 is still near all-time lows at 1.9% annually – prices at all-time highs.
If these facts are not enough to catch your attention, I could add that almost all psychological market indicators suggest stocks are overdue for a correction or worse. Volatility is near all-time lows, the level of bullishness among advisors and advisory newsletters is also close to a record (contrarian indicator). And, of course, finally the investing public has started to throw money blindly at the stock market, afraid of missing out on the apparently easy profits. These are all additional signs of “irrational exuberance” and as we all know, every bubble has ended badly for investors – lots of financial pain.
I have been concerned about overvalued stock prices since late 2013, but I have reluctantly gone along for the ride with heavy stock exposure the past three years and the ride has been enjoyable. Actually, the 8-year bull market ride has been quite fun, but it was much easier to justify staying fully invested in stocks when valuations were somewhat reasonable – not the case anymore. The vast majority of my clients (mostly Peninsula residents) are nearing retirement or already retired and I can no longer justify an overweight allocation to stocks. I have recently reduced risk and sold many stock positions. If history is a guide, given that we are at 2-standard deviation levels above long-term price trends in stocks – which is an acceptable definition of a bubble – returns going forward are likely to be below-average or even negative. Still, you hear almost no talk about prices being frothy or at risk of a serious decline. Heck, we haven’t had a bear market in 8 years (we are way overdue), when prices decline on average 30% and the aftermath of a bubble could show declines of 50% or more. Have you calculated how much your portfolio would decline if we entered another bear market? It’s easy to do – multiply the dollar amount you have in stocks by 20% (minimum decline to be considered a bear market) or 30% (average bear market decline) and that would indicate your dollar loss. Sure, perhaps the loss will be temporary, but my guess is it would be painful, nevertheless. And, we never know how long it will take for the market to recover, so “temporary” could mean a long wait to recover from those losses.
So, what is a prudent, rational investor to do? Well, you could do nothing and simply ride out the inevitable downturn and hope you live long enough to see your portfolio go on to make new highs at some point in the future. And, no doubt it will – you simply need an investing time horizon that is long enough for you to wait out any temporary decline. And, of course, you must be able to “stomach” portfolio losses that won’t be pretty and not panic and sell. So again, doing nothing is one option, but perhaps not that appealing to anyone nearing retirement or already retired.
My suggestion is that if you have enjoyed this long bull market in stocks, but are concerned about losing a significant portion of your profits in the next bear market, then protect at least a portion of your gains. Consider reducing risk, perhaps substantially, and rebalancing your portfolio now. Below I’ve compiled a simple, balanced portfolio that I have back-tested, that survived our most recent stock and real estate bubbles and Great Recession quite well. You could consider some combination of these low-cost holdings that fit your own risk profile and investment objectives. The 2017 All-Weather Portfolio had one slightly negative year in the last 10 years, showing a loss of only -1.0% in 2008 while during the same year the S&P 500 declined 37%. In addition, the portfolio has an annual yield of 2.6% which provides important cash flow for investors in need of income.
2017 All-Weather Portfolio
| Allocation | Name | Symbol | Yield | Expense Ratio |
| 25% | Vanguard Short-Term Corporate Bond Index | VCSH | 2.1% | 0.07% |
| 30% | Vanguard Intermediate-Term Bond Index | BIV | 2.8% | 0.09% |
| 10% | Vanguard Long-Term Bond Index | BLV | 4.1% | 0.09% |
| 10% | Vanguard Dividend Appreciation Index | VIG | 2.0% | 0.09% |
| 25% | Consumer Staples Select Sector SPDR | XLP | 2.4% | 0.14% |
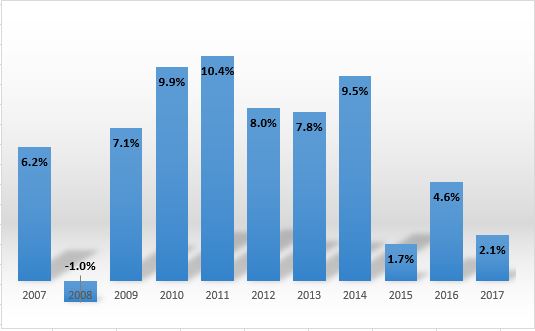
All Weather Portfolio Annual Returns*
*Hypothetical returns 2007 to present (3/10/2017)
At the time of publication, Stuart Chaussee and/or his clients held positions in BIV, BLV, VIG and XLP. Holdings can change at any time. Under no circumstances does the information in this column represent investment advice or a recommendation to buy or sell securities.